In September of 1962, President John F. Kennedy delivered a speech urging that the United States should “go to the moon … not because it is easy, but because it is hard.” In the early 1960s, none of the technology required to make the journey even existed, but in 1969 the U.S. succeeded in putting a man on the moon. It’s in this spirit of goal-driven innovation and a renewed, activist public sector that the Green New Deal hopes to use to address human-caused climate change.
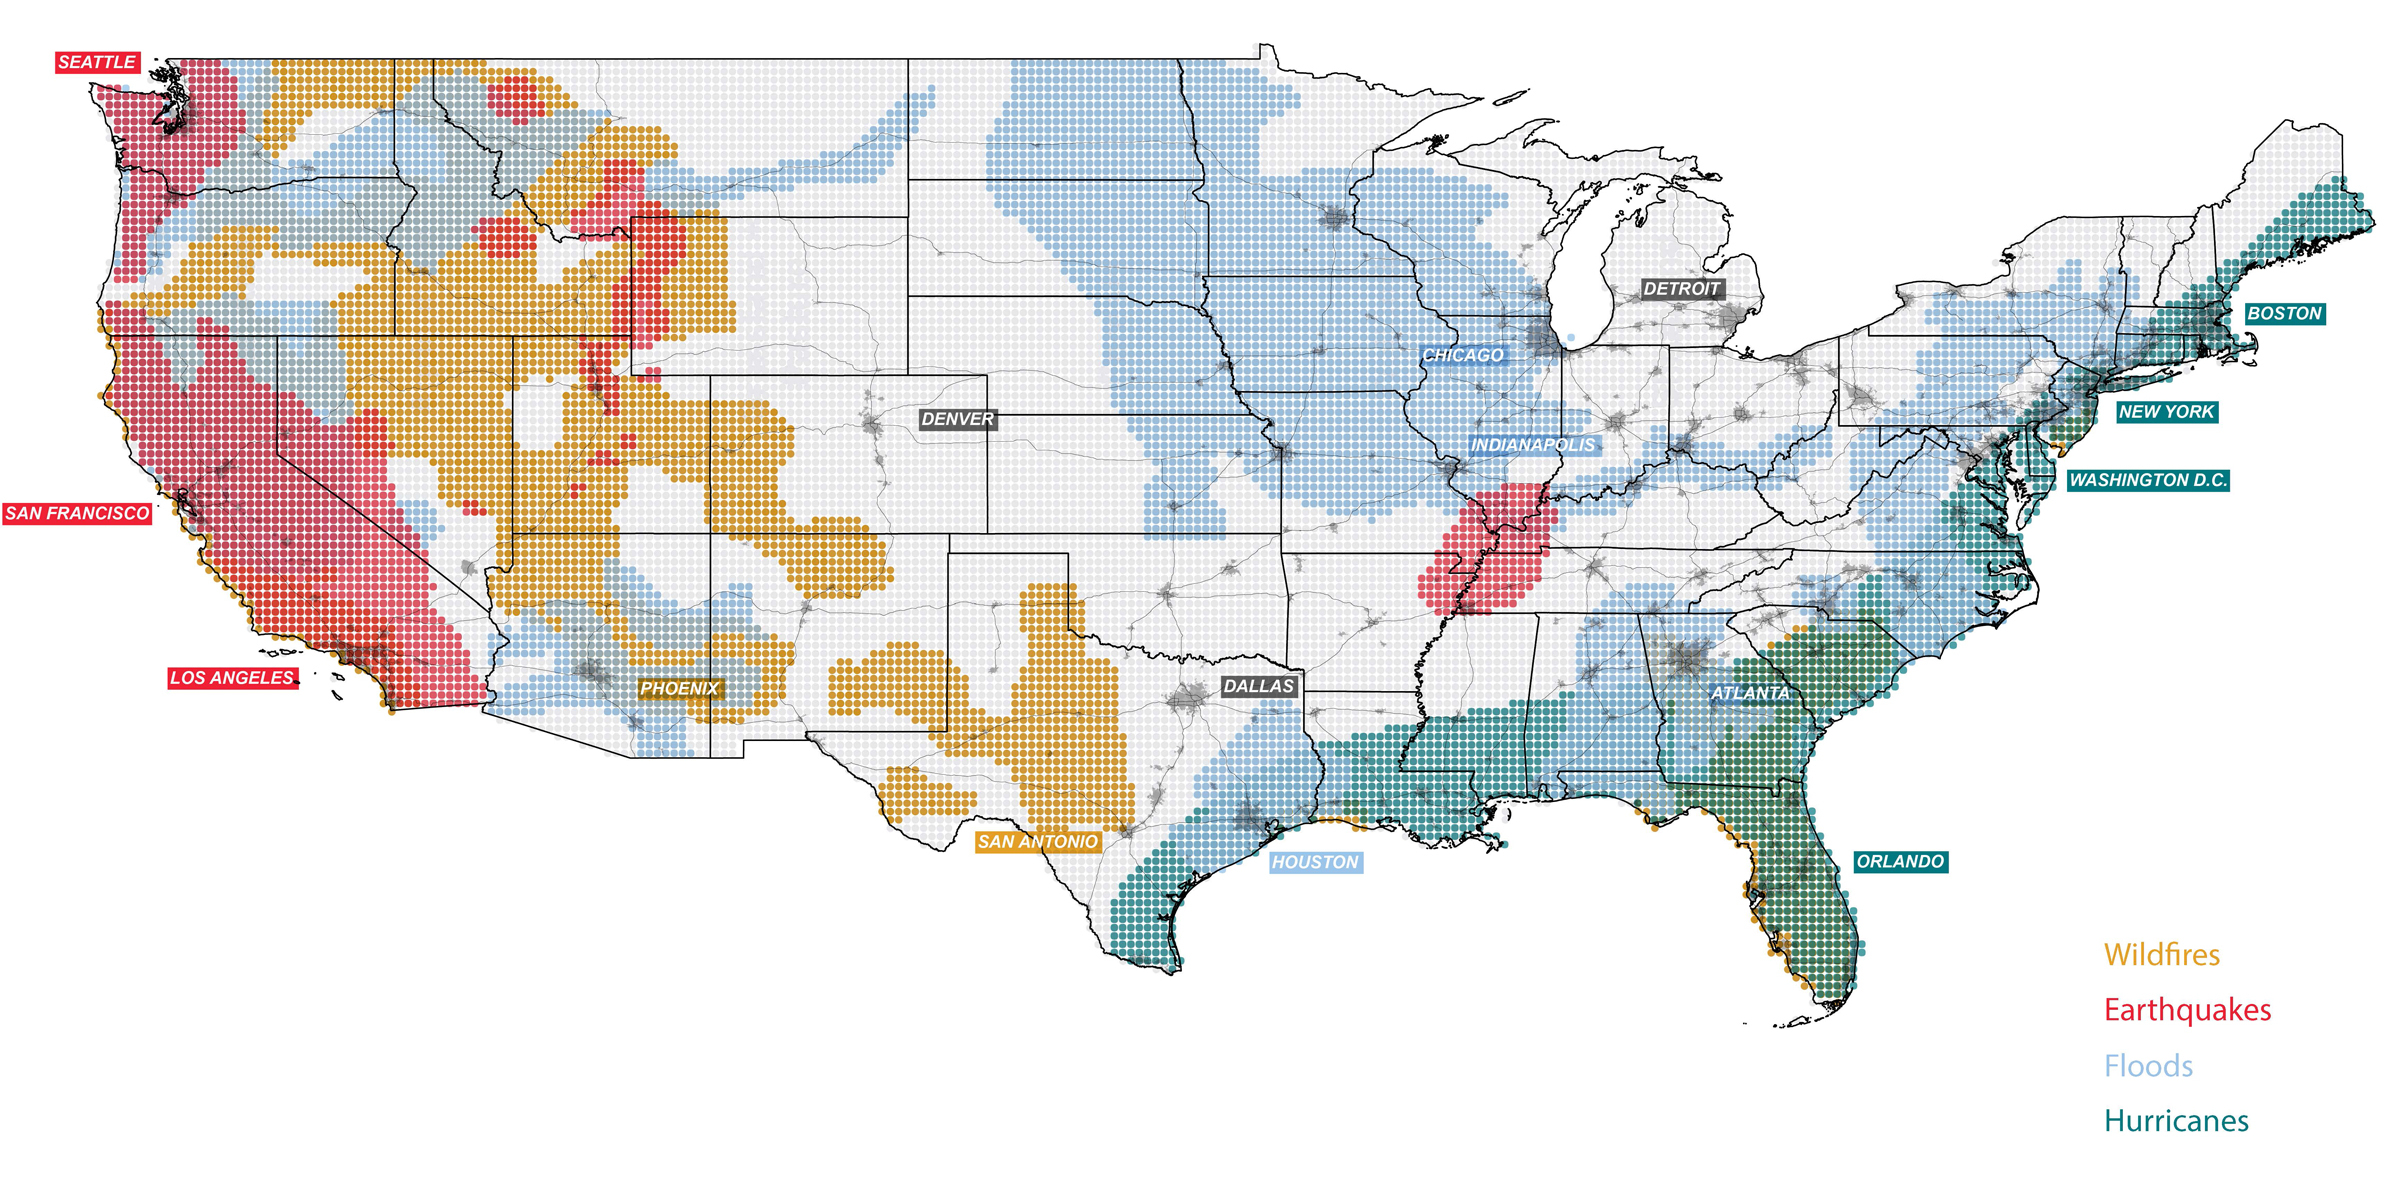
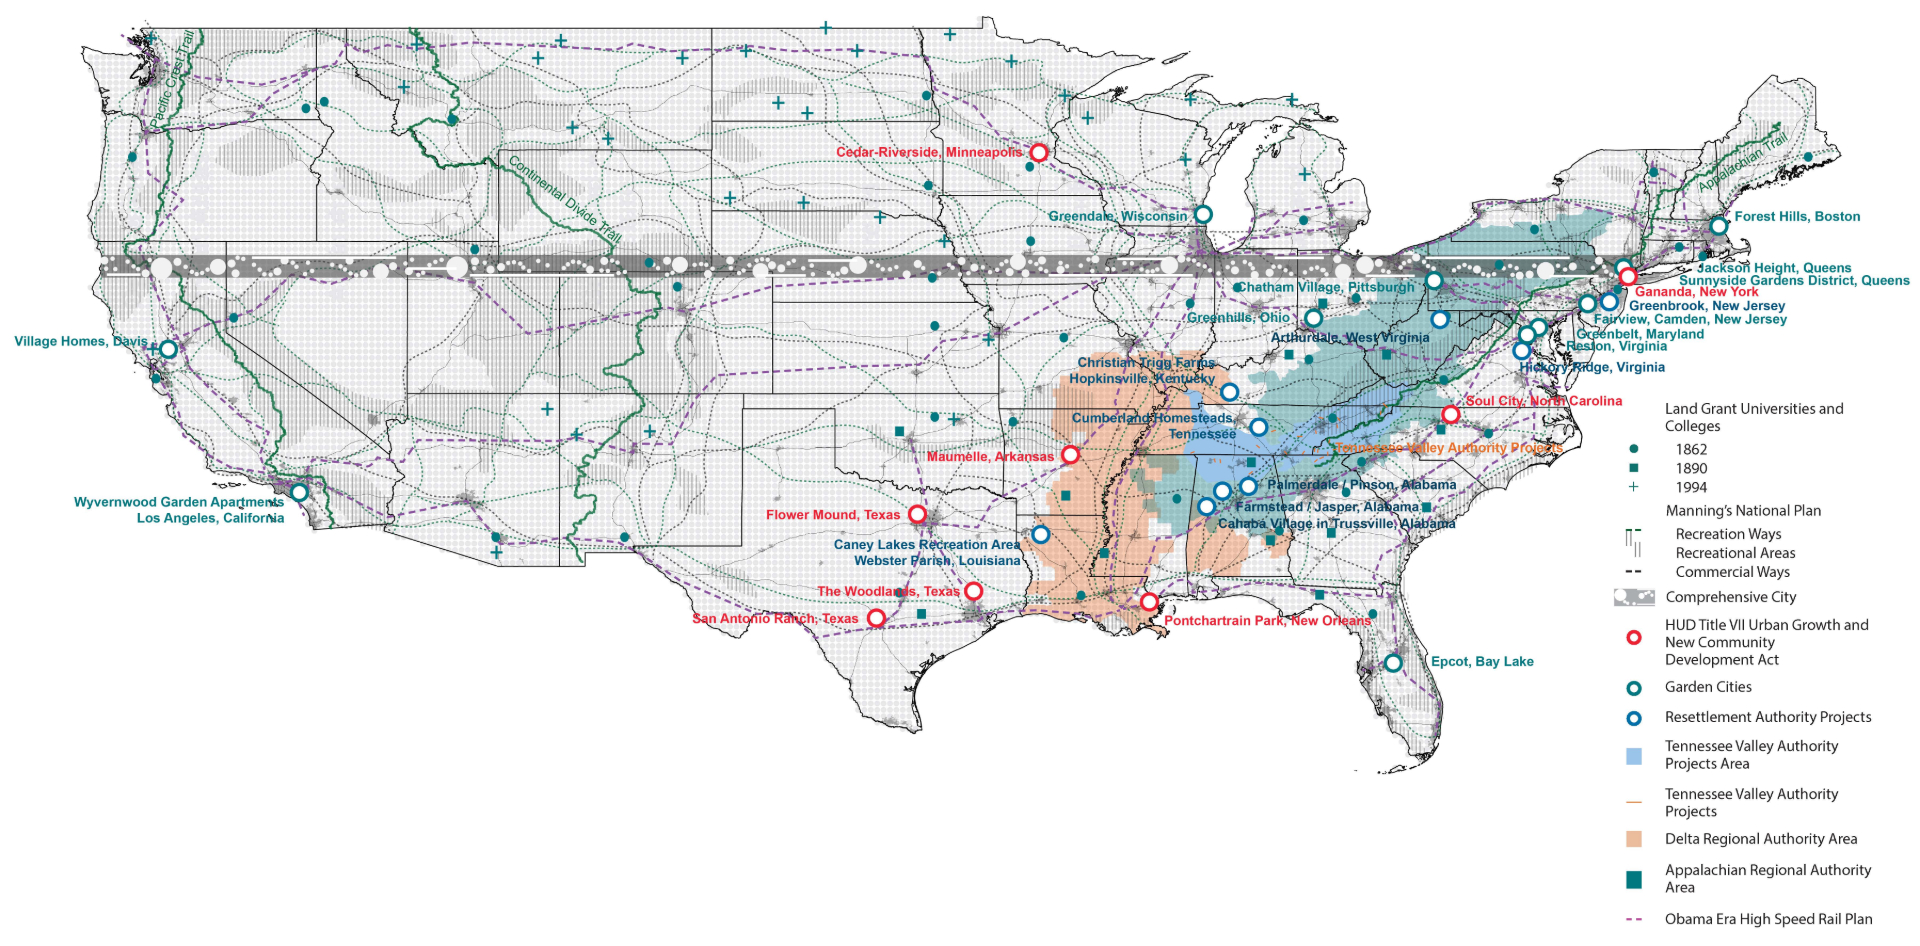
To help take the Green New Deal from idea to reality, Penn’s Ian L. McHarg Center for Urbanism and Ecology has launched The 2100 Project. The first installment of this initiative, published as “ An Atlas for the Green New Deal,” consists of more than 100 visualizations illustrating the projected spatial impacts of climate change and population growth in the United States for the rest of the century.
Conceived as a platform for legislators, planners, designers, and communities to understand the stakes of the climate crisis, the Atlas was collated and curated as a part of the McHarg Center’s ongoing Green New Deal research. The Center’s previous work in this area includes “A Green New Deal for American Public Housing Communities” and “A Green New Deal for NYCHA Communities,” research produced in partnership with Data for Progress and Penn’s Socio-Spatial Climate Collaborative (SC2) and linked directly to the first two pieces of tangible Green New Deal legislation.
The 2100 Project addresses the intersecting issues of human-induced climate change impacts, a projected U.S. population growth of 100 million people during the next century, and the need for aggressive efforts to reduce the economy’s reliance on extraction, production, and consumption. As the project’s first output, the Atlas draws on the work of scientists, geographers, economists, historians, and others to create a centralized, publicly available collection of visuals to help develop alternative visions for a future built by the Green New Deal.
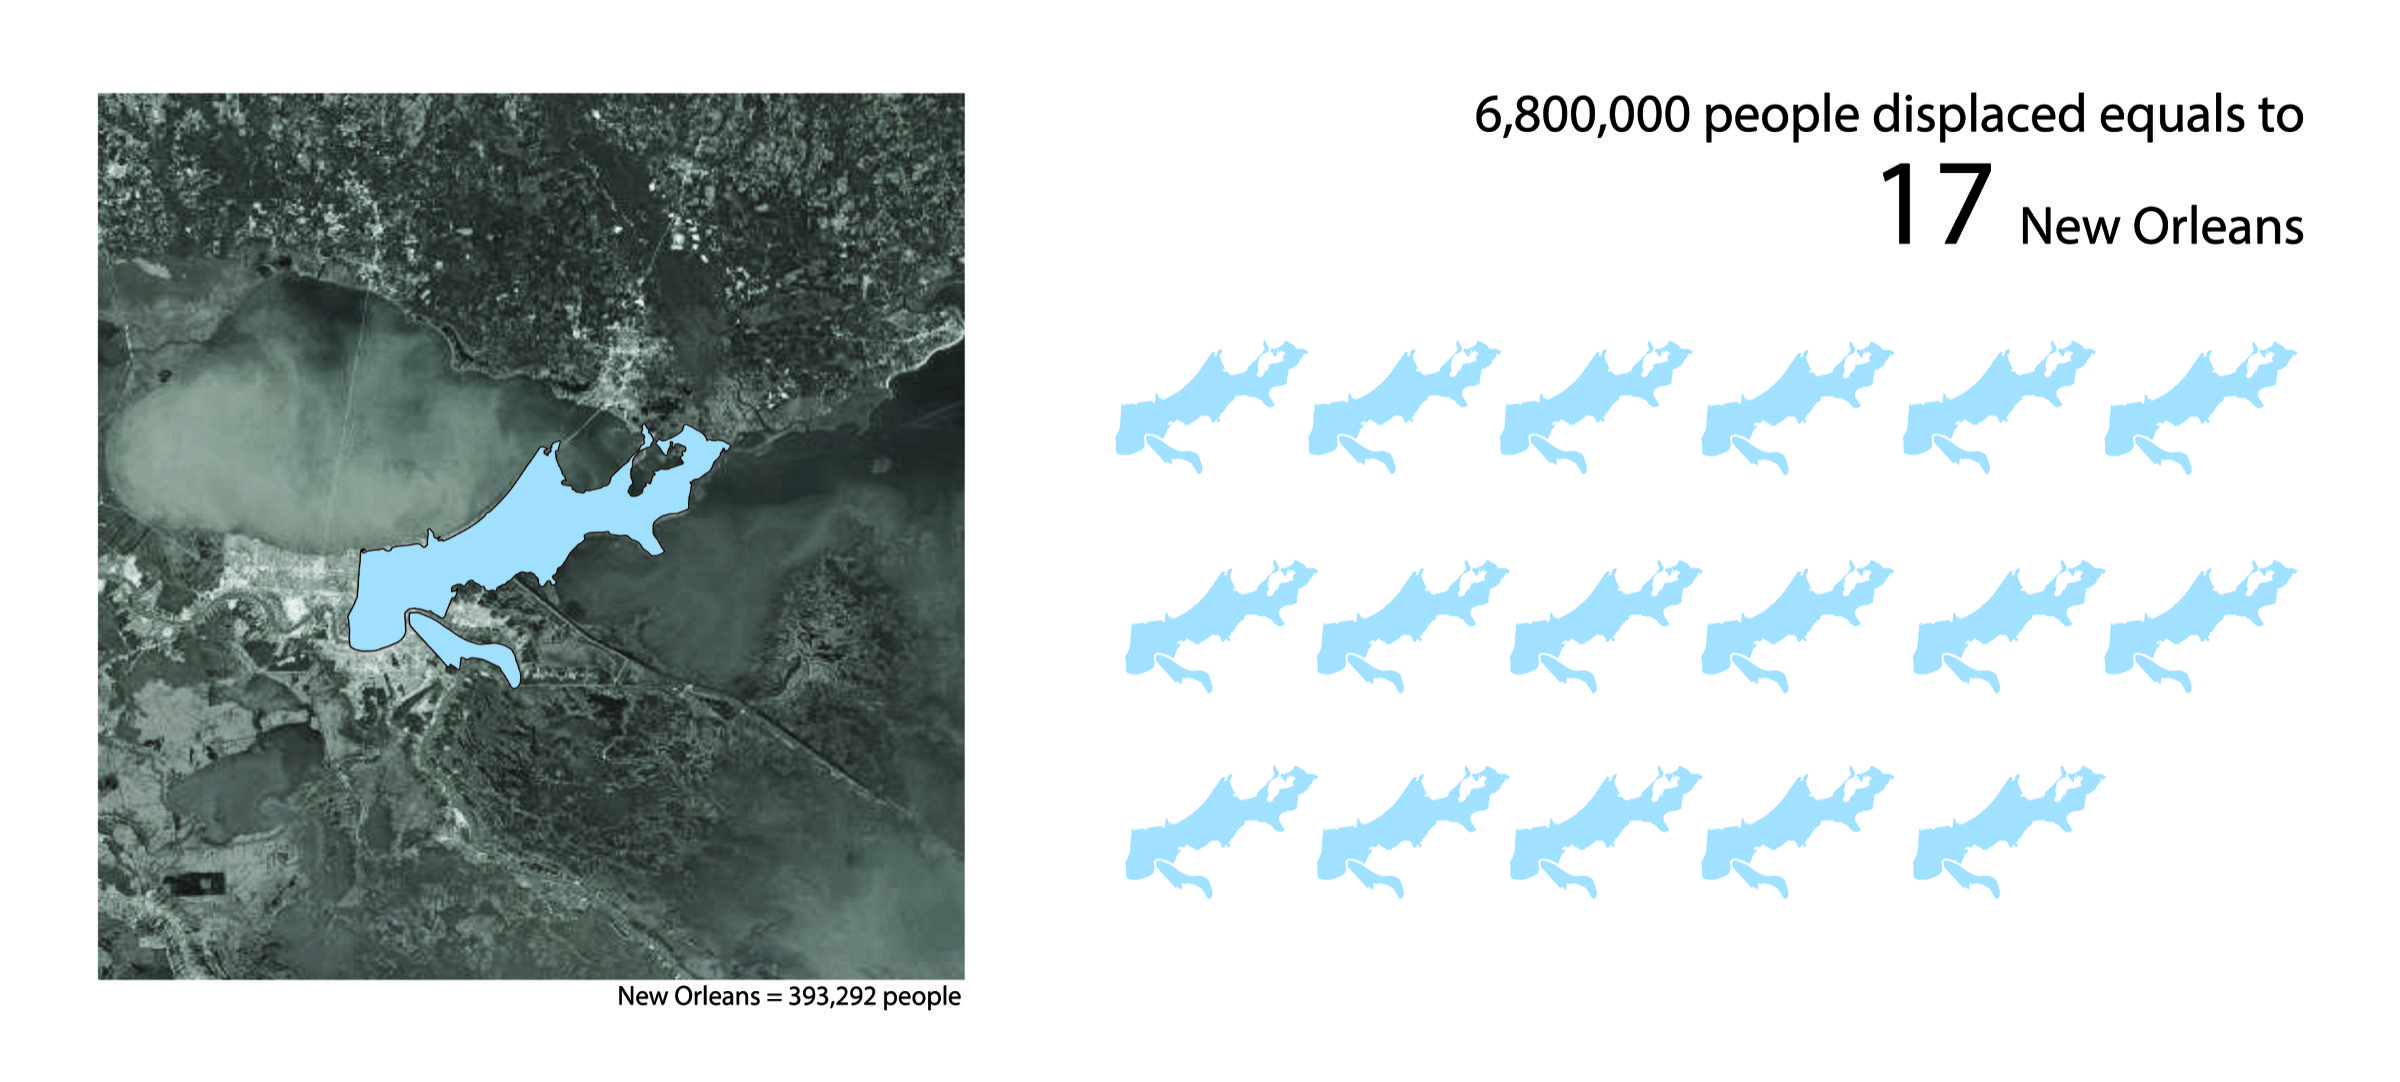
One of the goals for the Atlas is to provide communities grappling with the scale and scope of the challenges climate change will pose with real, tangible, freely available data they can use to develop plans for the future. Conservative population growth estimates state that more than 100 million people will migrate to the U.S., along with 13 million residents displaced by sea level rise, which doesn’t include tens of millions of Americans displaced by other factors such as heat or drought. Building and redeveloping enough housing to accommodate this population shift would be the equivalent of building 12 New York Cities by 2100, with a new one built every three-and-a-half years.
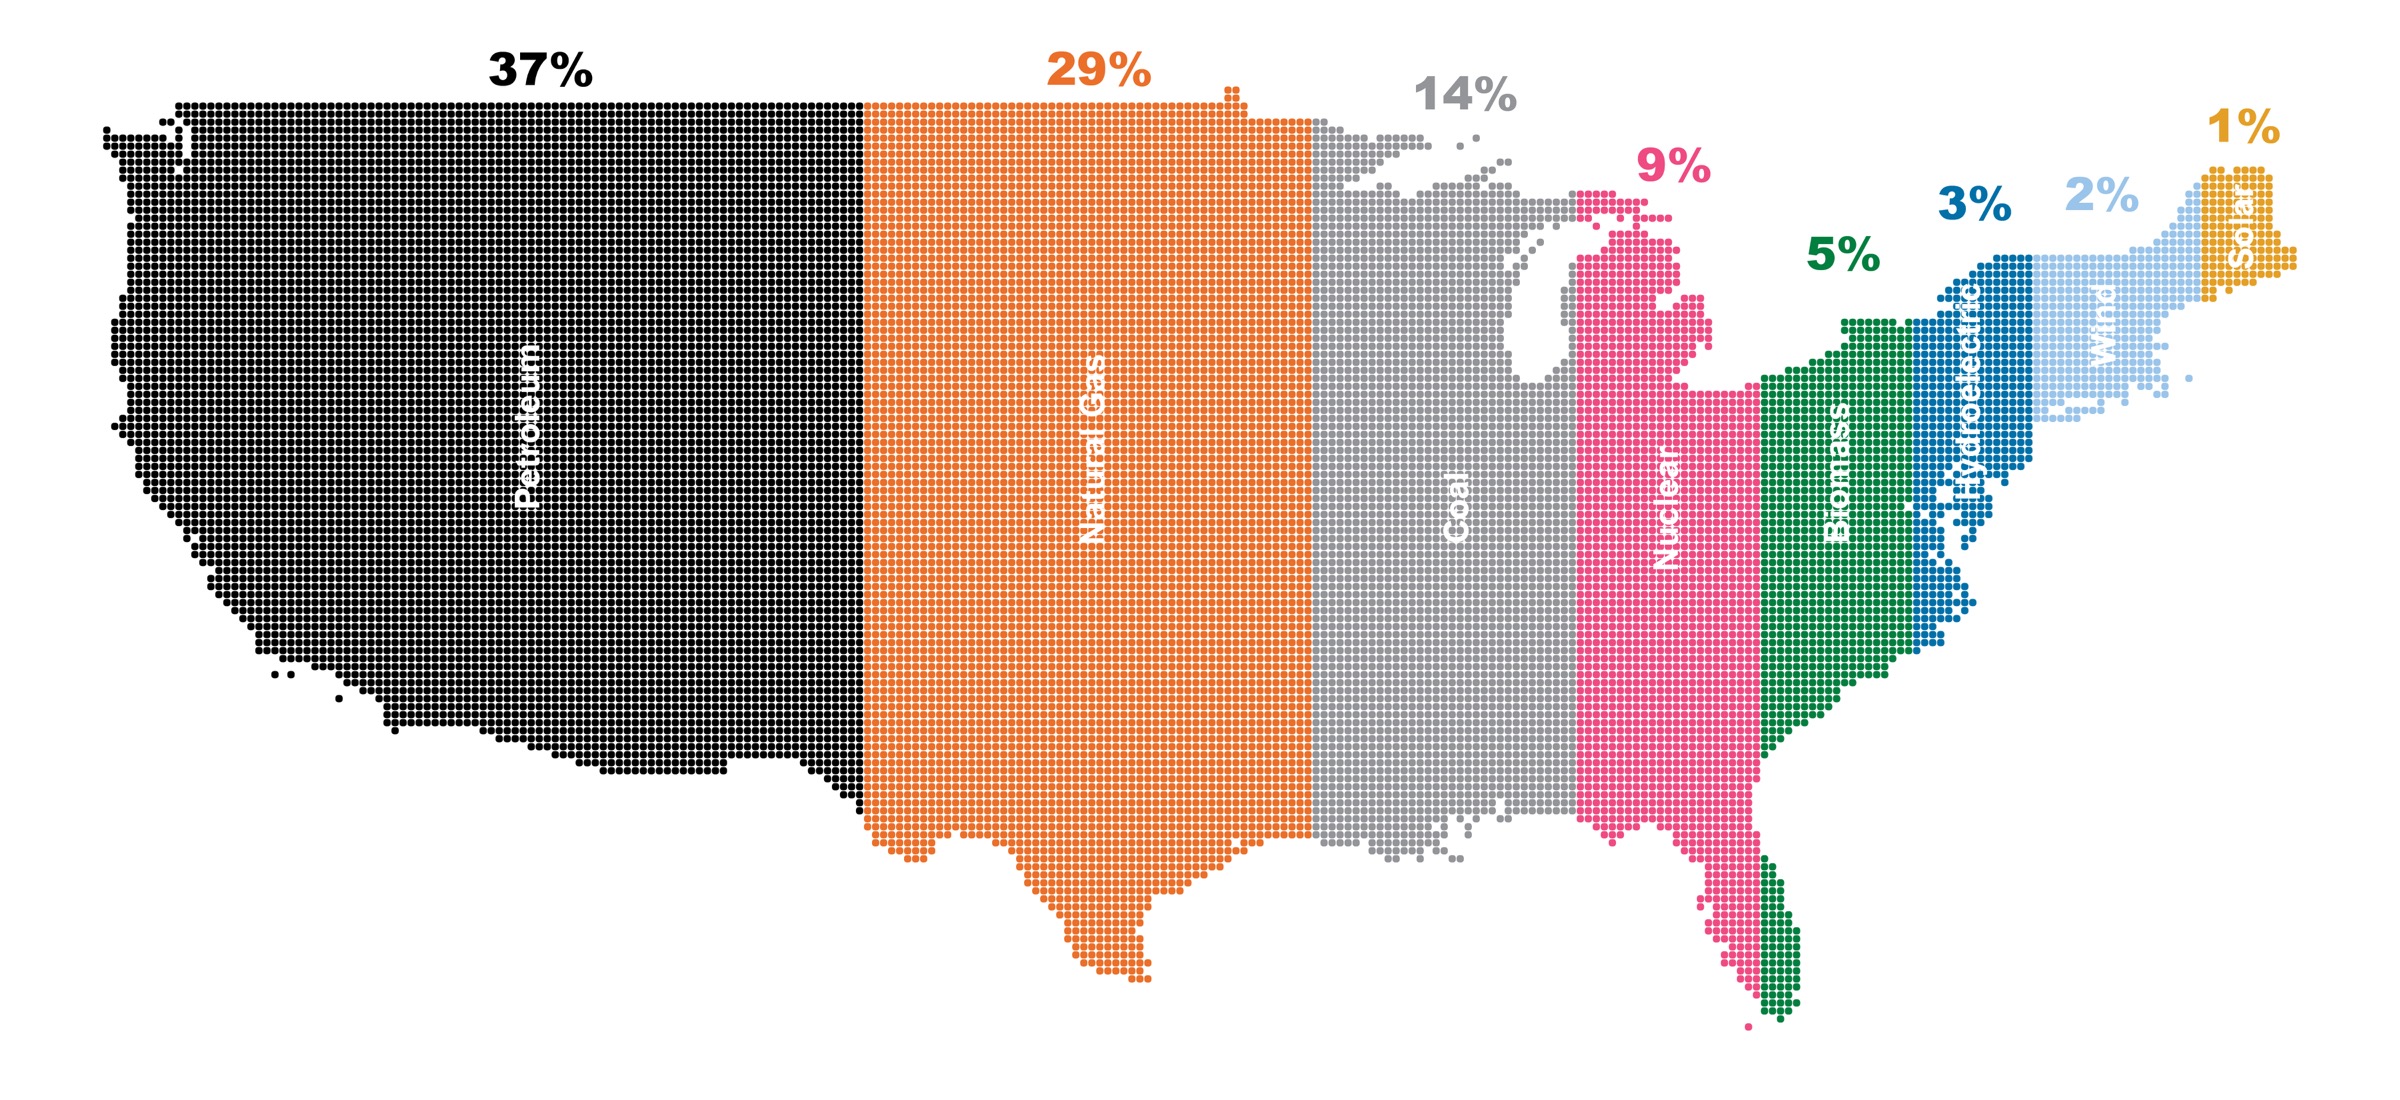
Powering the future U.S. also requires significant changes in infrastructure. Clean energy systems, whether powered by wind or solar, are land intensive, with some estimates saying that a clean energy smart grid would require twice as much land than is currently used for energy. Coping with climate change also requires legislators and developers to understand the spatial requirements of population growth and agricultural needs in the context of a green economy.
As a world leader in landscape architecture, the Stuart Weitzman School of Design has a history of uniting spatial expertise and imagination to tackle ideas in both design and environmentalism. In addition to ongoing research activities and offering a “Designing a Green New Deal” landscape architecture studio this fall, the McHarg Center also recently hosted the largest climate event in the history of Penn.
The 2100 Project also challenges the myth that the public sector cannot undertake ambitious projects. With bold, national-scale climate action both possible and necessary, the Atlas provides information for understanding the stakes of inaction, the potential priority regions for climate investment, and the possibilities of a future reshaped by the Green New Deal. Much like the Apollo program made the ambitious goal of reaching the moon when the path ahead was still uncertain, the Green New Deal can meet ambitious goals by mobilizing the public sector.
“The Green New Deal and climate change are not going away,” says Billy Fleming, Wilks Family Director of the McHarg Center. “If we’re going to address the climate crisis on the scale at which it is occurring, we have to scale up the ability of the government and communities to take on this generational challenge.”
Fleming adds that it is easy to look at the scale of the challenge posed by climate change and the goals of the Green New Deal, like achieving carbon neutrality by 2050, and believe that they are impossible. But, he adds, “The reality is that we’ve never actually tried to craft a national response to these threats. We won’t know what we’re capable of achieving until, as the Green New Deal demands, we mobilize our communities, resources, and government around climate action.”
“The Atlas for the Green New Deal” can be accessed at https://mcharg.upenn.edu/2100-project-atlas-green-new-deal.
Project co-authors include the McHarg Center’s Anna Darling, Billy Fleming, Zachary Hammaker, Nicholas Jabs, Shawn Li, Xan Lillihei, Qi Wang, Richard Weller, Rachel Creager, and Ao Zhang.
The mission of the Ian L. McHarg Center for Urbanism and Ecology is to build on the University of Pennsylvania Stuart Weitzman School of Design’s position as a global leader in urban ecological design by bringing environmental and social scientists together with planners, designers, policy-makers, and communities to develop practical, innovative ways of improving the quality of life in the places most vulnerable to the effects of climate change.