In 1998, astronomers discovered that the universe is expanding at an accelerating rate, thanks to a mysterious force called dark energy that makes up about 70% of the universe. The discovery came as a surprise as it countered the prevailing notion that the universe’s expansion should be slowing down because of gravity.
The breakthrough, which astronomers achieved by making calculations with observations of specific kinds of exploding stars, called type 1a supernovae, received the Nobel Prize in Physics in 2011.
Now, 25 years after the initial discovery, the Dark Energy Survey (DES) has released the results of an analysis using the same technique to further probe the mysteries of dark energy and the expansion of the universe. In a presentation at the 243rd meeting of the American Astronomical Society on Jan. 8, and in a paper submitted to the Astrophysical Journal, Masao Sako of the School of Arts & Sciences at the University of Pennsylvania and other DES astronomers reported results that are consistent with the standard cosmological model of a universe with an accelerated expansion. Yet, the presenters noted that their findings are not definitive enough to rule out a possibly more complex model.
“It was exciting to ‘unblind’ our results and to look at the latest and greatest measurements on the amount of dark matter and dark energy, and see this effort come to an end,” says Sako. “It was definitely an emotional moment for me.”
Taking a unique approach to analysis
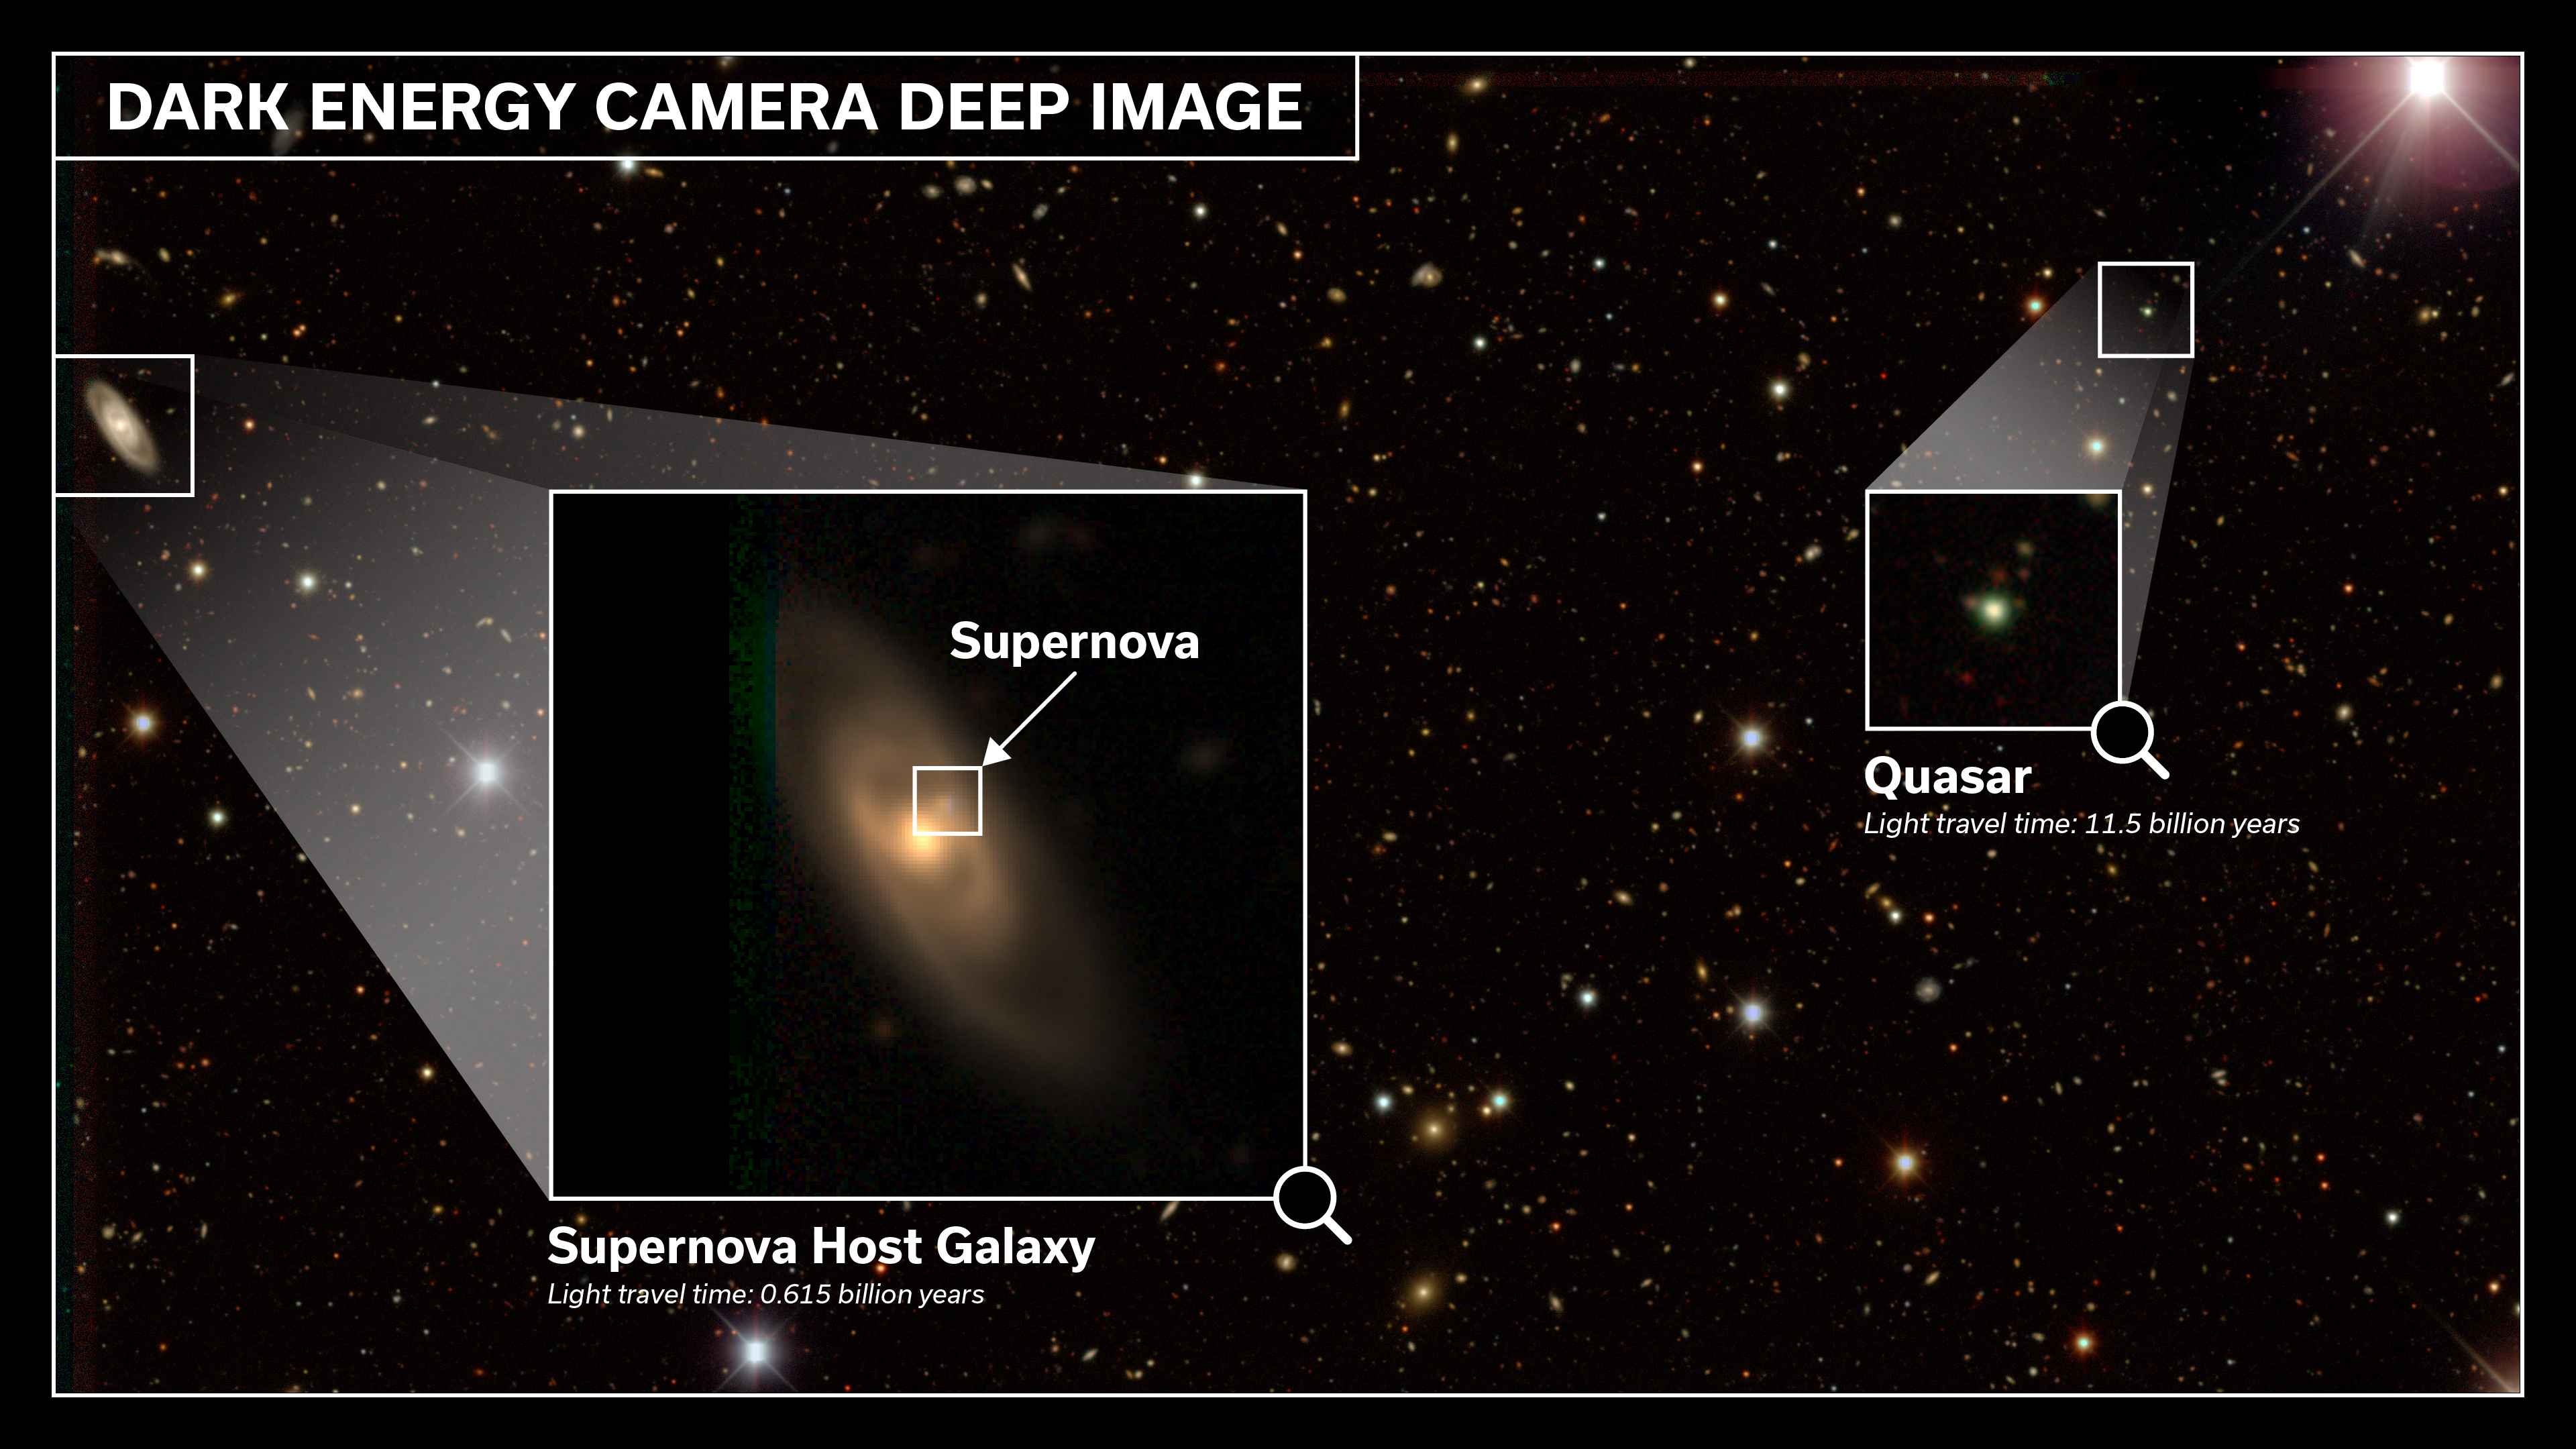
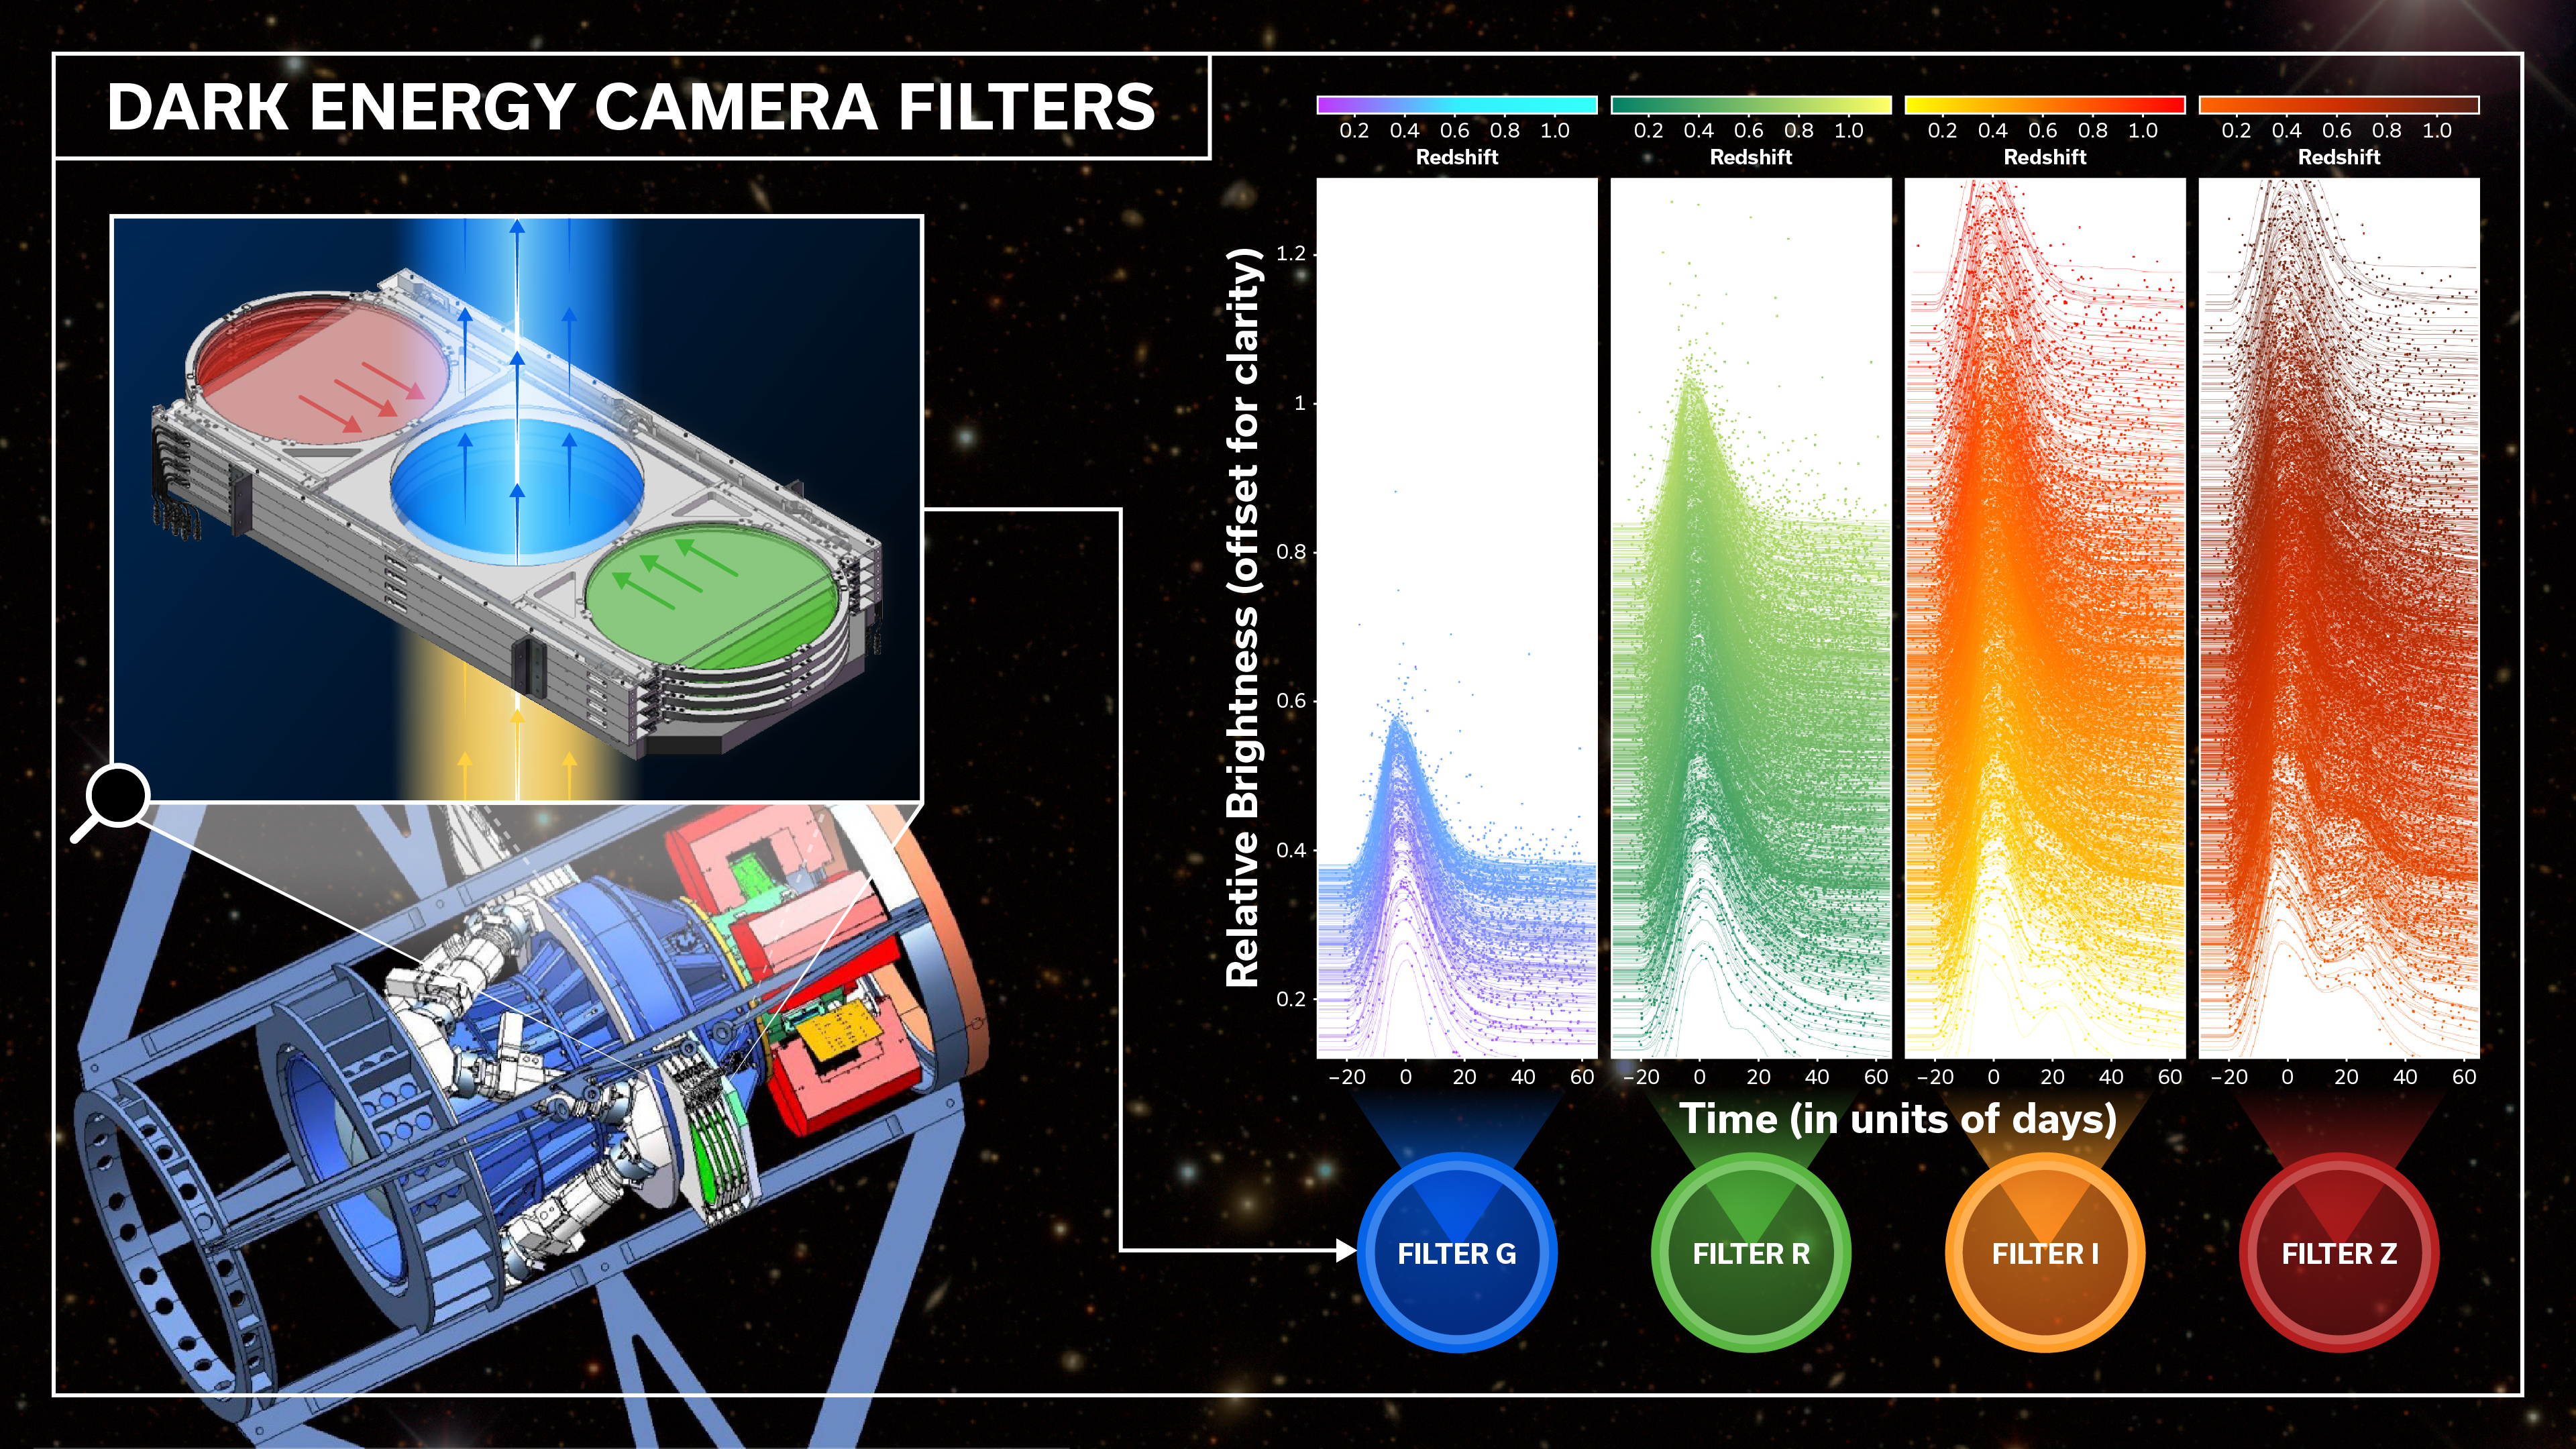
The DES is an international collaboration made up of more than 400 scientists from over 25 institutions. Hosted by the U.S. Department of Energy’s Fermi National Accelerator Laboratory, DES mapped an area almost one-eighth of the entire sky using the Dark Energy Camera, a 520-megapixel digital camera supported by the DOE-Office of Science and mounted on the Blanco 4-meter telescope at the National Science Foundation’s Cerro Tololo Inter-American Observatory in Chile. DES scientists took data for 758 nights over the course of six years.
To understand the nature of dark energy and measure the expansion rate of the universe, DES scientists perform analyses with four different techniques, including the supernova technique used in 1998.
Sako and his team began work on the DES in 2010, while the camera was still under construction and their major contribution to the project was in designing the survey strategy for the supernova technique. This involved choosing which areas of the sky to observe, setting the cadence for observations, and setting up simulations of the full survey to precisely determine what to expect from their imaging data.
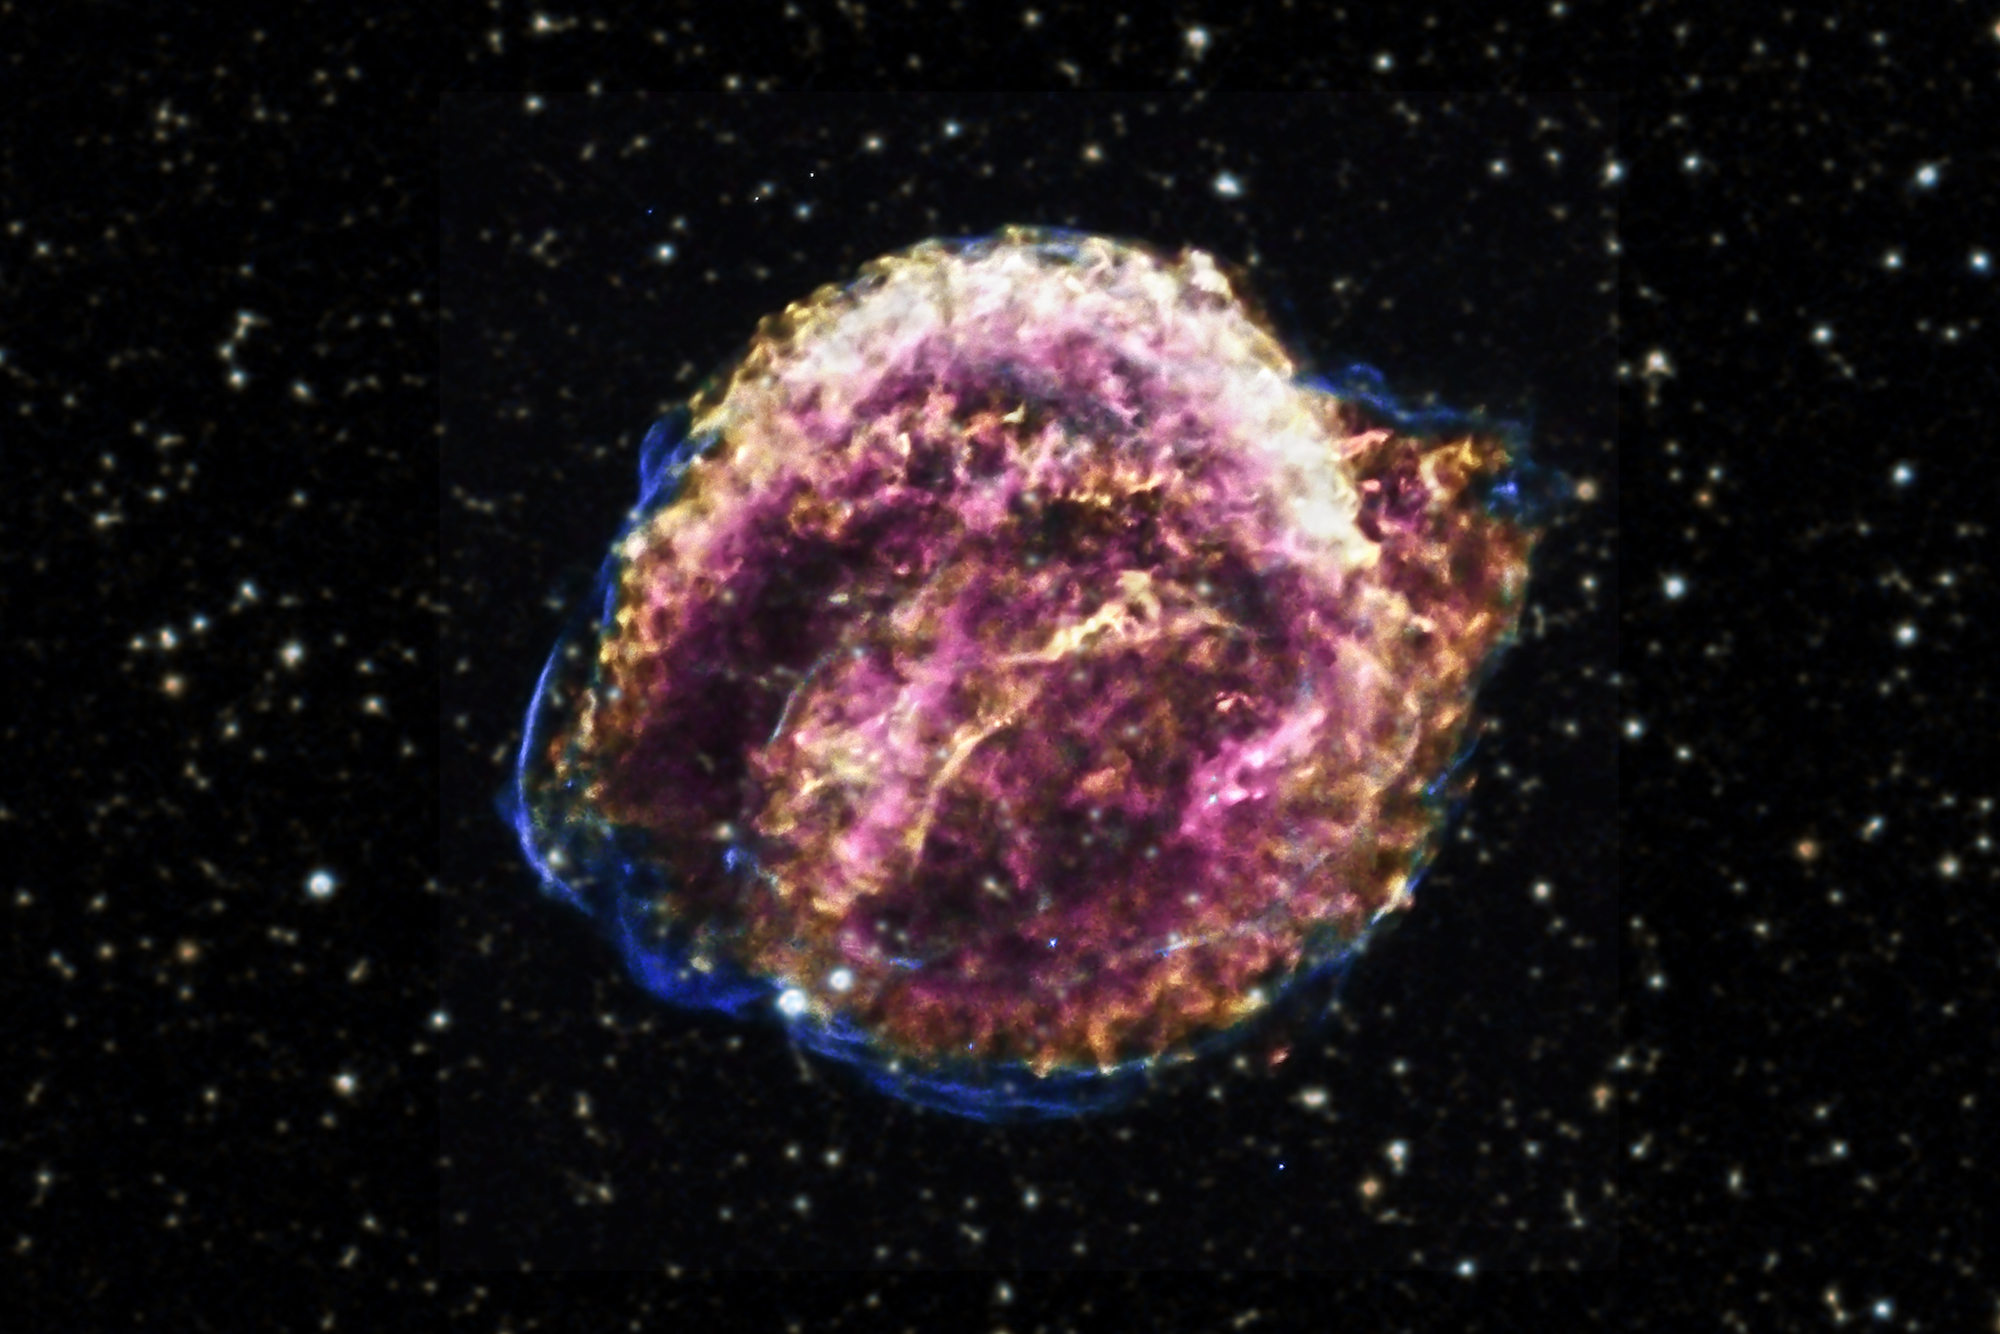
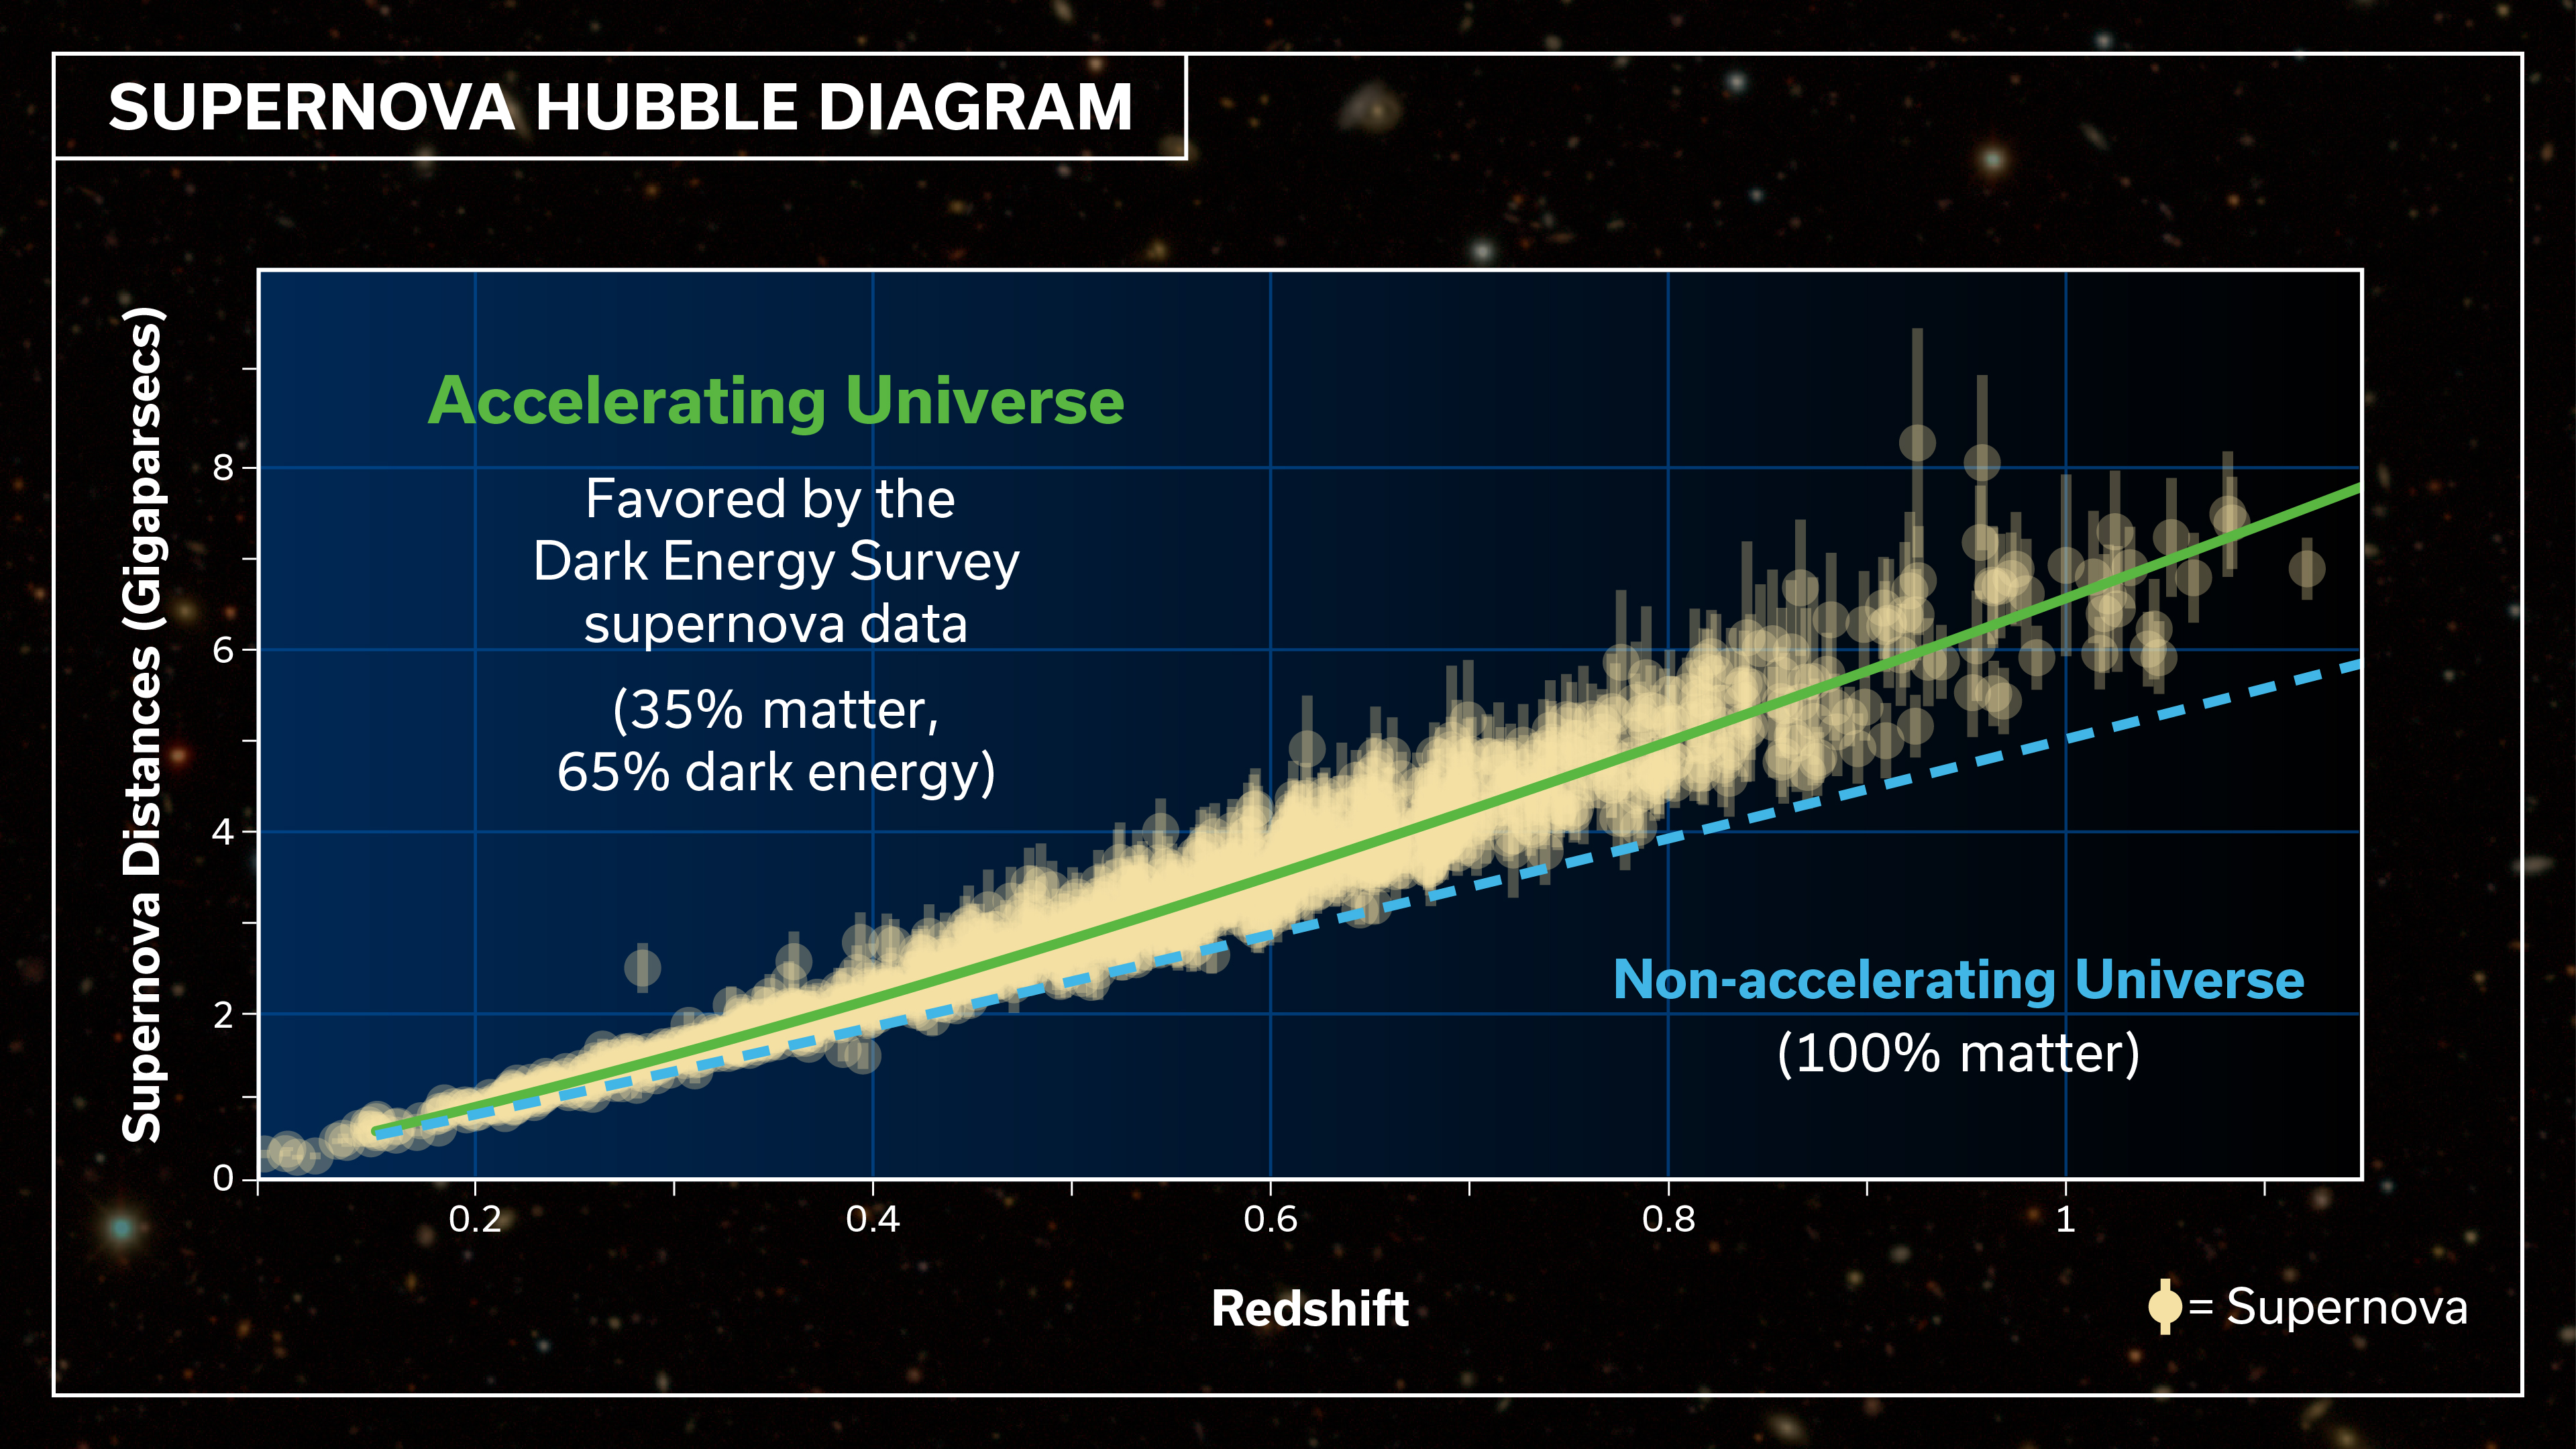
The researchers explain that this technique requires data from type 1a supernovae, which occurs when an extremely dense dead star, known as a white dwarf, reaches a critical mass and explodes. Since the critical mass is the same for all white dwarfs, all type 1a supernovae reach approximately the same levels of brightness. So, when astronomers compare a type 1a supernova’s apparent brightness as seen from Earth to its true brightness, they can determine the supernova’s distance from us.
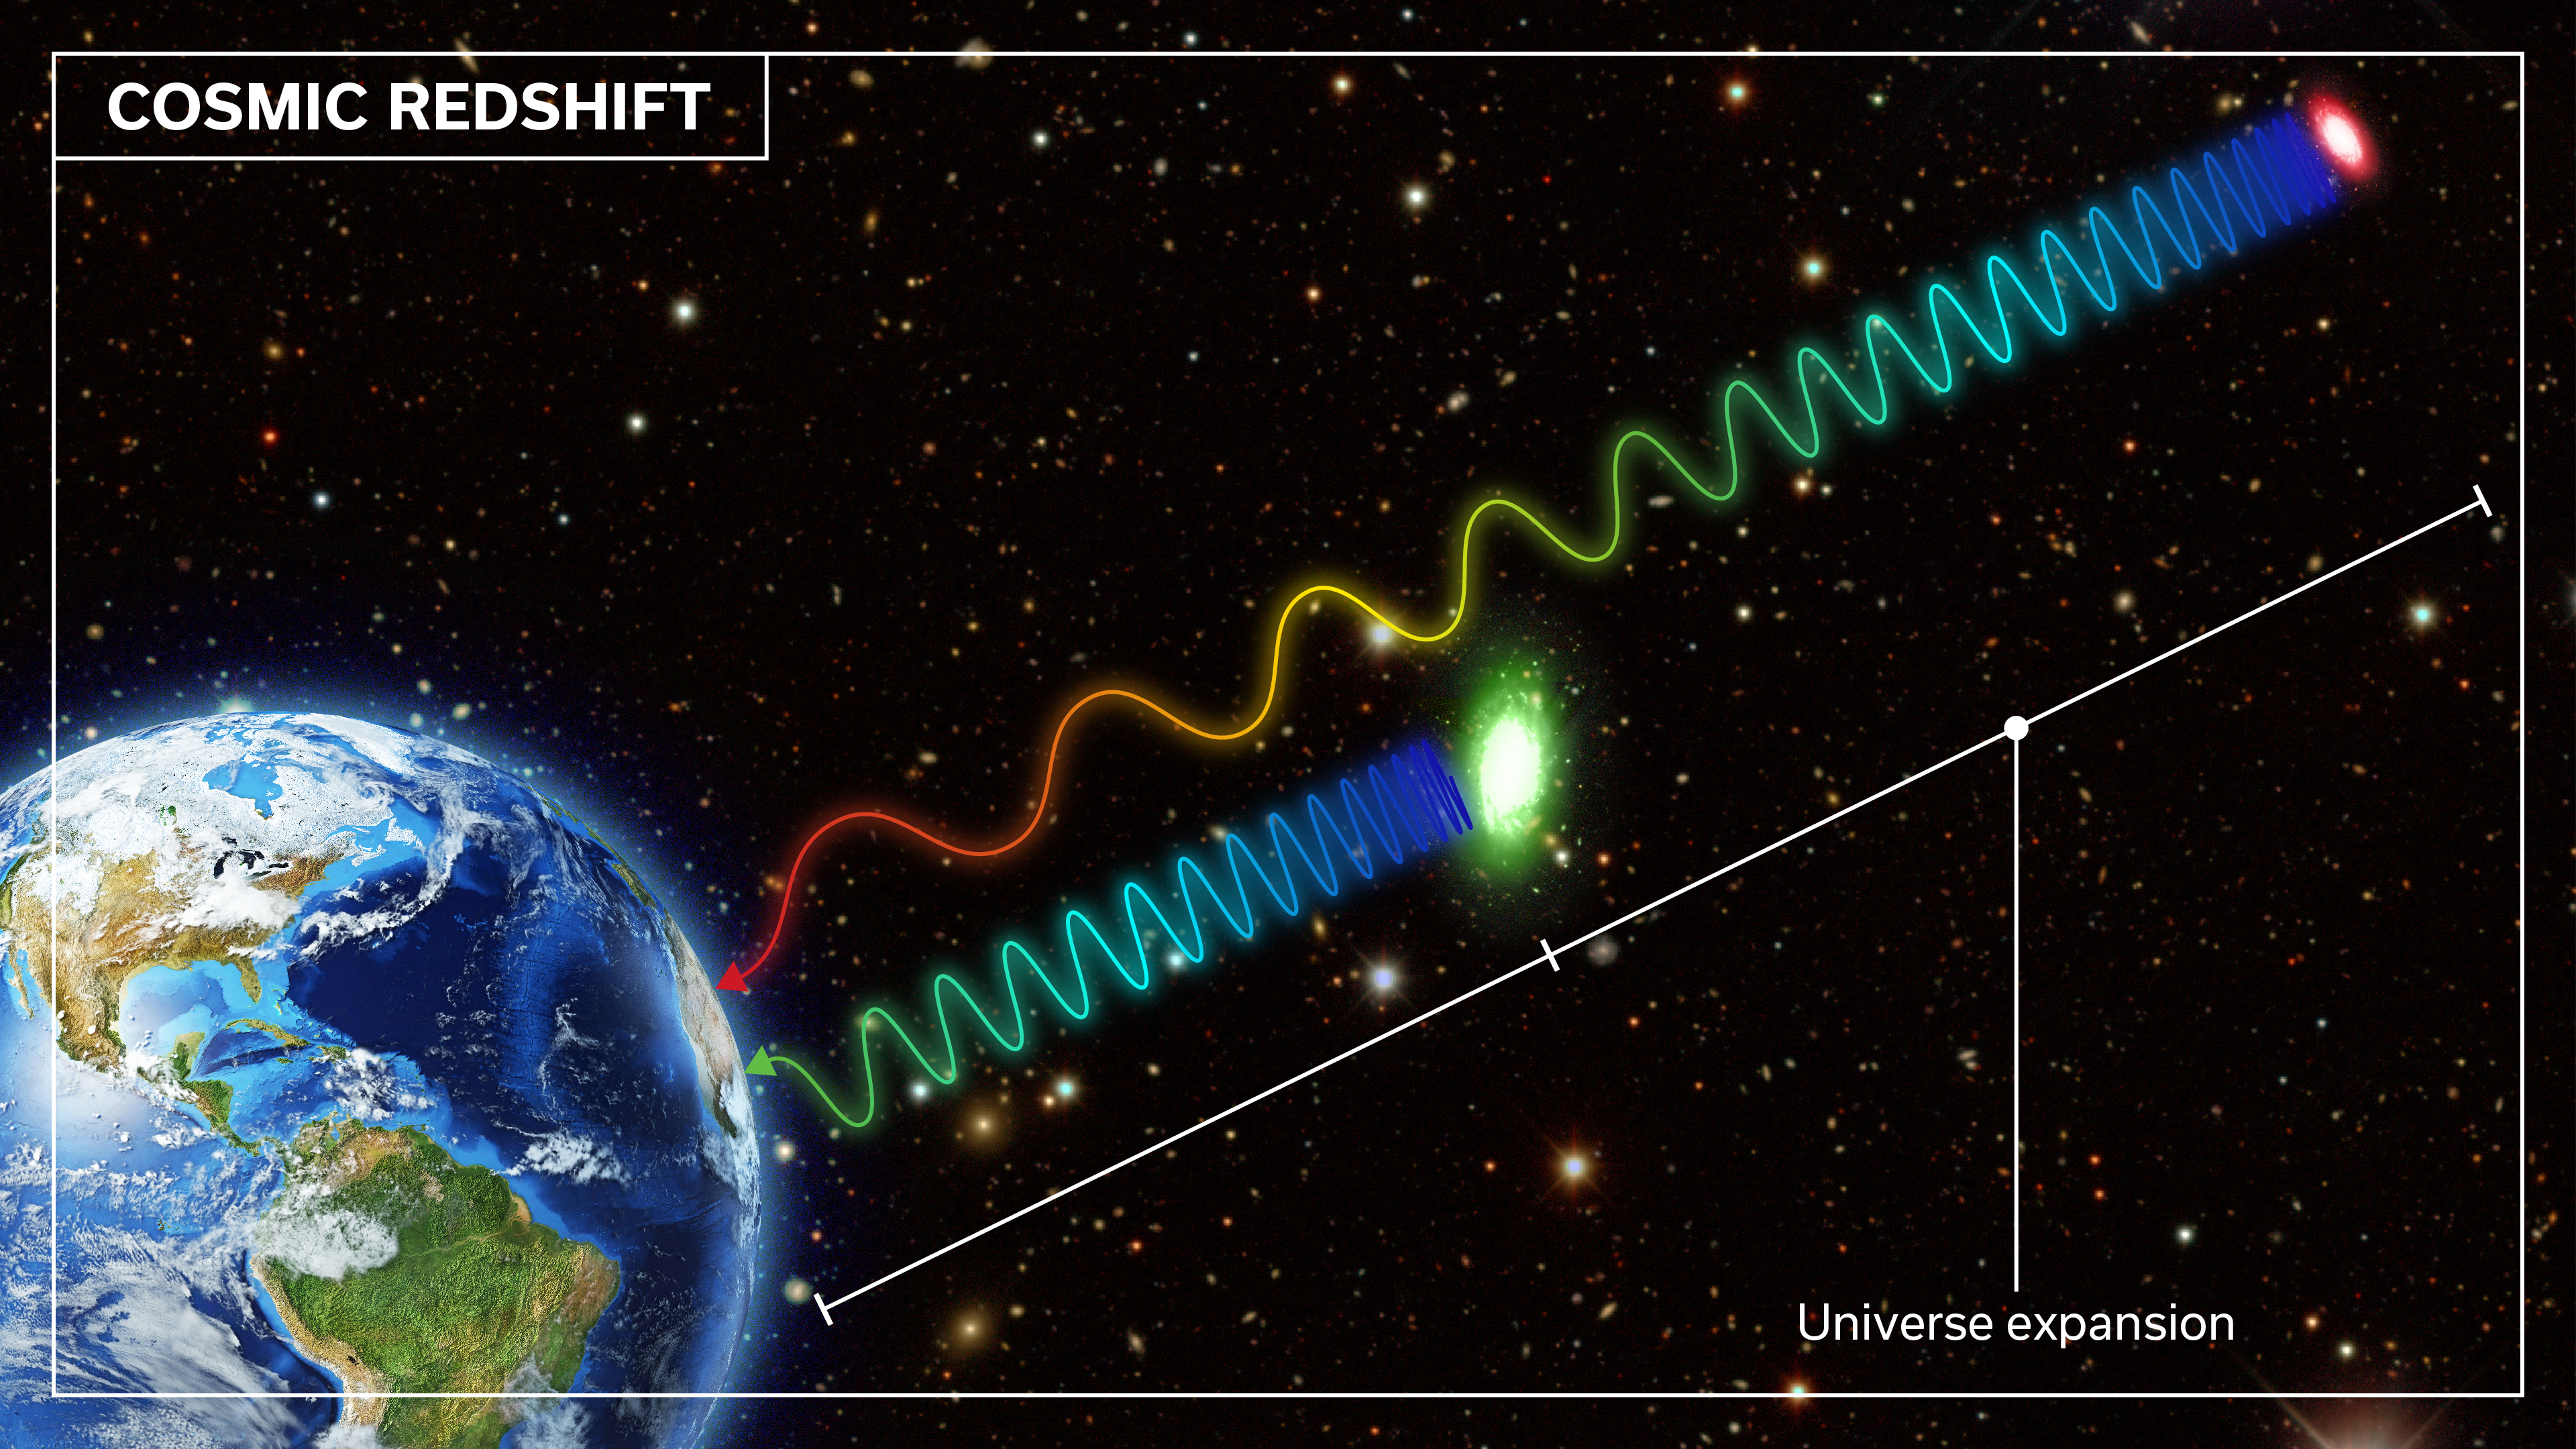
There is a strong correlation between a supernova’s distance and its redshift—a measurement of how quickly it is moving away from Earth. Combining these two values reveals how fast the universe was expanding when the supernova occurred. Astrophysicists can compare that combined rate to the rate of expansion today to determine whether the dark energy density has remained constant or changed over time.
“As the universe expands, the matter density goes down,” says Richard Kron, director of the DES. “But if the dark energy density is a constant, that means the total proportion of dark energy must be increasing as the volume increases.”
The culmination of a decade of effort
DES collaborator Tamara Davis, a professor of astrophysics at the University of Queensland, Australia, notes the standard cosmological model, known as LambdaCDM, is the leading theory that describes how the universe works. “It tells us how the universe evolves using just a few features, such as the density of matter, type of matter, and the behavior of dark energy,” she says.
Davis explains that the supernova method constrains two parameters very well: matter density and w, which indicates whether the dark energy density is constant or not. According to the standard cosmological model, the amount of dark energy in the universe is constant, which means it doesn’t dilute as the universe expands. If this is true, a parameter represented by the letter w should equal –1.
The culmination of a decade’s worth of effort, it was an emotional time for many astrophysicists involved. “I was shaking,” says Davis, who is also co-convener of DES’s supernova working group. “It was definitely an exciting moment.”
The results found w = –0.80 +/- 0.18. Combined with complementary data from the European Space Agency’s Planck telescope, w creeps even closer to –1—but still doesn’t quite reach –1 within the error bars.
“w is tantalizingly not exactly on –1, but close enough that it’s consistent with –1,” says Davis. “A more complex model might be needed—dark energy may indeed vary with time.”
To come to a definitive conclusion, astrophysicists will need more data. But DES won’t be able to provide that; the survey stopped taking data in January 2019. DES collaborators are still conducting analyses with other techniques. The supernova team, led by many Ph.D. students and postdoctoral fellows, will soon have extracted all they can from the DES observations.
“Combining the DES supernova information with these other probes will even better inform our cosmological model,” says Davis.
The supernova team will soon have extracted all they can from the DES observations. Soon, experiments like the Rubin Observatory will pick up where DES left off—probably doing the same kinds of analyses. “We’re pioneering these techniques that will be directly beneficial for the next generation of supernova surveys,” says Kron.
Pioneering a new approach
This 2018 analysis, DES supernova analysis made many improvements upon DES’s first supernova result released in 2018 that used just 207 supernovae and three years of data. Davis and Sako say the team, led by many Ph.D. students and postdoctoral fellows on DES, improved their analysis at every step. It took many years of work, but the collaboration was able to halve their systematic uncertainty and greatly lower the statistical uncertainty.
“It’s been such a rewarding experience being here for the final push of the DES supernova analysis,” says Helen Qu, a current Ph.D. student working with Sako. “I’m certainly looking forward to further cosmological insights with Rubin.” Qu developed one of the machine learning methods used for the analysis and compiled the full catalog of galaxies observed by DES. A host galaxy is identified from this catalog for each supernova and used to obtain ultra-precise redshift measurements for the supernovae.
Jason (Jaemyoung) Lee, another one of Sako’s Ph.D. students, says, “It has been an amazing experience to be part of this collaborative effort, I truly learned a ton from my collaborators. I also really got to appreciate how much effort goes into making sure that our results are robust.” Lee has quantified how much our atmosphere impacts the DES supernovae flux measurements depending on the color of the supernovae.
Another improvement was that Sako’s team and the other DES researchers used the most advanced machine-learning techniques to aid in supernova classification. Among data from 300 million distant galaxies observed, Sako’s Supernova Working Group at DES found 1,499 type 1a supernovae, making it the largest, deepest supernova sample from a single telescope ever compiled.
In 1998, the Nobel-winning astronomers used just 52 supernovae to determine that the universe is expanding at an accelerating rate. “It’s a really massive scale-up from 25 years ago,” says Davis.
These DES supernovae also have more-precise data than previous surveys because they were observed in four colors of light filters—a major advancement compared to the Nobel-winning supernovae samples, which only used one or two light filters.
“[This new supernova result] is exciting because this means we can really tie a bow on it and hand it out to the community and say, ‘This is our best attempt at explaining how the universe is working,’” says Davis. “These constraints will now be the gold standard in supernova cosmology for quite some time.”
Even with more advanced dark energy surveys forthcoming, DES scientists emphasized the importance of having theoretical models to explain dark energy in addition to their experimental observations. “All of this is really unknown territory,” Kron says. “We do not have a theory that puts dark energy into a framework that relates to other physics that we do understand. For the time being, we in DES are working to constrain how dark energy works in practice with the expectation that, later on, some theories can be falsified.”
“Even if we measure dark energy infinitely precisely, it doesn’t mean we know what it is,” says Davis. “Dark energy is still out there to be discovered.”
Funding for the DES Projects has been provided by the U.S. Department of Energy, the U.S. National Science Foundation, the Ministry of Science and Education of Spain, the Science and Technology Facilities Council of the United Kingdom, the Higher Education Funding Council for England, the National Center for Supercomputing Applications at the University of Illinois at Urbana-Champaign, the Kavli Institute of Cosmological Physics at the University of Chicago, Funding Authority for Funding and Projects in Brazil, Carlos Chagas Filho Foundation for Research Support of the State of Rio de Janeiro, Brazilian National Council for Scientific and Technological Development and the Ministry of Science and Technology, the German Research Foundation and the collaborating institutions in the Dark Energy Survey.