What prompted the most recent research?
Our goal was to understand how well different regions are doing month by month, say, by U.S. county. Companies like Gallup do some polling. They ask how satisfied with your life and how stressed you are, but they don’t poll enough people to know, say, how people in Santa Clara County are doing this month. Particularly in the current era, where things are different this month from last, we’d love to have more detailed spatial and temporal resolution.
However, asking a bunch of people these questions is super expensive. Probably the best way to get at this information is to monitor the words that people produce. A good public source of those words is Twitter, so we, like lots of researchers, have been grabbing billions of tweets and looking at words.
When you say ‘word,’ what do you mean?
Everything’s a word. An emoticon’s a word.
Ok, so you pull every word from more than 1.5 billion tweets. Then what?
We try to figure out where they came from, which U.S. county they came from, which we can do for maybe a quarter of them by looking at the profiles. Then we go to Gallup, which has nicely shared with us its survey information, and we take the average over multiple years of answers to the questions they’ve asked. For the more populous counties, we have both the words people used and the average satisfaction with life reported, and then it’s pretty simple. We look at which words correlate. Which are used more in happier counties? Which are used less in happier counties?
What did analyzing the words in those tweets tell you about how satisfied people are?
You’d think that places that are tweeting more words like ‘happy’ and ‘love’ and ‘excited’ would be happier and that places tweeting more words like ‘depressed,’ ‘miserable,’ ‘unhappy,’ and ‘sad’ would be less happy. We found that was mostly the case, but not entirely.
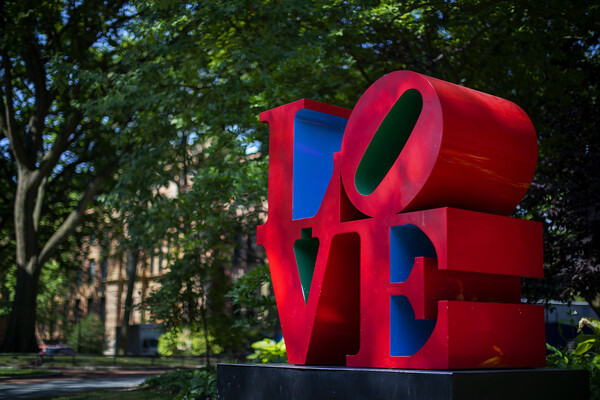
Counties that talk more about ‘love’ are, on average, less happy, less satisfied with life than ones that tweet less about it, even though we know that there are many good things about love. Using the word ‘love’ is not, on average, indicative of happiness, however. That’s true of other common words like ‘LOL’ and ‘good’ and ‘respect,’ which you think are positive but can be used negatively, as in the case of, ‘I get no respect.’ Words that are positive or negative don’t necessarily convey the feeling that you might think they would.
How does this fit into the overall body of work you’ve done in this area? What differentiates it?
We’ve been trying to understand how we can use the language in social media to identify people who are more or less stressed, lonely, empathetic, or depressed. Many models were built at the individual level. But it’s not always the case that individual-level models generalize perfectly to communities. Communities require different analysis. What we’re trying to do in this work is to better understand how we can predict for this community how stressed they are this month versus last month.
It seems like this work could have implications for the situation we’re in with COVID-19 and social distancing. Can you talk about that?
We’re pulling tweets every day, and we can monitor how different parts of the U.S. are faring over time using the models we developed. How are different regions in the U.S. shifting? We also pull tweets that mention COVID-related terms. As COVID passes through the U.S., people seem to be discussing different symptoms of the disease at different times, having different arguments about masks. These data also show us how stress levels are changing. Not surprisingly, people are, on average, way more stressed and anxious.
We just submitted a paper that finds that for the average person in one of our studies the overall decrease in happiness is comparable to going from a weekend day to a weekday. In general, Saturdays are happy days in America. On Mondays and Tuesdays, people are not quite as happy. Every day is now like a weekday. If you lose your job it is, of course, far worse.
The Penn COVID-19 Twitter map recently went live. What does it show?
It allows you to look state by state at what people are saying about COVID, as well as some measurements of how stressed and anxious people are. It’s a concrete version of, ‘Click on this page, look for this state,’ and see how stressed or anxious they are, as estimated by their Twitter language. These techniques are particularly important in these fast-changing times. The mental health of America is changing very quickly, and these methods are currently our best way to get at rapid changes in stress, anxiety, and depression across the U.S.