Dark Energy Survey interim analysis sheds light on the evolution of the universe
Analysis of the survey’s first three years of data, which were used to make the most precise 3D map of the universe to date, is a key step towards understanding dark matter and dark energy.
Ten areas in the sky were selected as “deep fields” that the Dark Energy Camera imaged multiple times during the survey, providing a glimpse of distant galaxies and helping determine their 3D distribution in the cosmos. (Image credit: Dark Energy Survey)
Interim results published by the Dark Energy Survey (DES) provide new insights into the structure and evolution of the universe. Analysis of the survey’s first three years of data, which includes the most precise 3D map of the universe to date, is a key step towards ongoing efforts to measure the distribution of dark matter and dark energy to see if data are consistent with the standard cosmological model.
The ultimate goal of DES, a global collaboration of more than 400 scientists from 26 institutions, is to understand the role of dark matter and dark energy in the accelerating expansion of the universe as well as its overall structure and evolution. Because ordinary matter makes up only 5% of the universe, cosmologists hypothesize that an unseen force counteracting gravity, called dark energy, could make up 70% of the universe. The remaining 25%, called dark matter, is hypothesized to help bind galaxies together.
Penn researchers who are members of the DES collaboration include professors Gary Bernstein, Bhuvnesh Jain, and Masao Sako; research scientist Mike Jarvis; and a team of students, postdoctoral researchers, and staff from the Department of Physics and Astronomy. “Here at Penn, we are fortunate to have had a brilliant group of students and postdocs who have led the analysis, spanning pixel level images to theoretical cosmological inference,” says Jain.
Towards a better understanding of dark matter and dark energy
During the course of its six-year mission, which was completed in January of 2019, DES surveyed one-eighth of the entire sky over 758 observation nights, collecting images of hundreds of millions of galaxies and thousands of supernovae. The interim analysis from the first three years of the survey was conducted on 226 million galaxies observed during 345 observation nights.
DES relied on a 570-megapixel camera, known as DECa, mounted on the Victor M. Blanco Telescope 4-meter telescope at the Cerro Tololo Inter-American Observatory in Chile. (Image: Reidar Hahn/Fermilab)
To quantify the distribution of dark matter and the effect of dark energy, DES relied on two phenomena: galaxy clustering and weak gravitational lensing. On large scales, galaxies are not distributed randomly but instead form clustered, weblike structures due to dark matter’s gravitational pull. Using DES data, researchers were able to see how this cosmic web of galaxy clusters evolved and have found regions with higher densities of dark matter than predicted.
In addition to looking at galaxy clustering, DES can detect dark matter signatures using weak gravitational lensing, which occurs when light from a distant galaxy travels through space and gravity causes it to bend, resulting in a distorted image. By studying how the apparent shapes of distant galaxies are aligned with each other and with the positions of nearby galaxies, researchers are able to infer the distribution of dark matter.
In their latest analysis, DES researchers compared the DES data on the current structure of the universe with cosmic microwave background measurements from the European Space Agency’s Planck observatory, which reveal the structure shortly after the Big Bang. The current physical model of the universe predicts what the DES data should look like given the starting point from Planck—do the DES data match? While there have been persistent hints from DES and other surveys that the universe is less “clumpy” than predicted, the third-year results are consistent with existing predictions and observations made by Planck. If future analyses of the remaining three years of DES data no longer agree, however, it could mean that there is an additional as-of-yet undiscovered aspect of the universe.
“We have spent much of the past 20 years developing the theory, techniques, and hardware to conduct these measurements, along with taking the data and analyzing it,” says Bernstein. “It’s a pleasure and a thrill to see these results.”
Massive and collaborative undertaking
Making sense of the massive amount of data collected in just the first three years of DES has been an enormous undertaking for DES researchers. Since the first year of data was released in 2017, the team has been working on new methods and analytical techniques which they continually refine and improve as new data become available.
The interim analysis includes 30 pre-print papers on catalogs, calibration methods, theoretical models, and cosmological results. Together, these interdependent studies were essential for creating what is now the largest and most precise map of the distribution of galaxies across the universe and will also be an essential part of analyzing the remaining three years of DES data.
The extent of the DES dark matter map of the sky, the largest created to date, using data from the first three years of the survey. The bright spots represent the highest concentrations of dark matter, while darker areas indicate low densities. (Image: Dark Energy Survey)
One key challenge faced by researchers was finding a way to determine the redshift of a specific galaxy, an indication of how far away a galaxy is, since its wavelength is stretched and becomes more red in color. Because DES does not directly measure redshift, its distribution has to be inferred from other data, meaning that there is inherent uncertainty within the redshift distribution that then becomes propagated into downstream analyses.
To address this challenge, Penn postdoc Carles Sánchezdeveloped a method that uses weak lensing effects to help constrain redshift distributions. His study, one of three approaches for obtaining better redshift estimates, helps DES researchers obtain more precise constraints on key cosmological parameters that are essential for understanding the nature of dark matter.
“One of the most important things of this analysis is that we've actually advanced the state of the art in the field in several parts, especially in redshift calibration, which was one of the most concerning things for everyone before,” Sánchez says.
Another new analysis led by Penn researchers includes a results paper by Ph.D. student Shivam Pandey, which found that a combination of data, including galaxy positions, shapes, and a cross-correlation of the two endpoints, can be used to determine the density of dark matter or dark energy property from the dataset. “This constrains the equation of state of dark energy, and it is very important in that it feeds into the key results directly,” says Pandey. “This paper also builds upon all the other papers that have contributed to the methodology advances used here.”
Postdoc Marco Gatti is the lead author of two papers: a new method for inferring galaxy distance and redshift distributions and an updated weak lensing galaxy shape catalog. He is also the co-lead author on a third: the weak lensing mass map.
“This map is a legacy for our collaboration and also for other scientists around the world that can use this map for any scientific purposes,” says Gatti. “In the past, we presented one method to create the map, and this time we presented four methods and did a comparison concerning the strengths and the weaknesses of each. I think this really advances the field because now we have a better understanding of which mapping techniques are better.”
The future of DES
With the experience of completing the analysis of the first three years of DES data, researchers are now prepared to handle the complete six-year data set. The final analysis, expected to begin towards the end of this year, should provide an even more precise picture of the dark matter and dark energy in the universe.
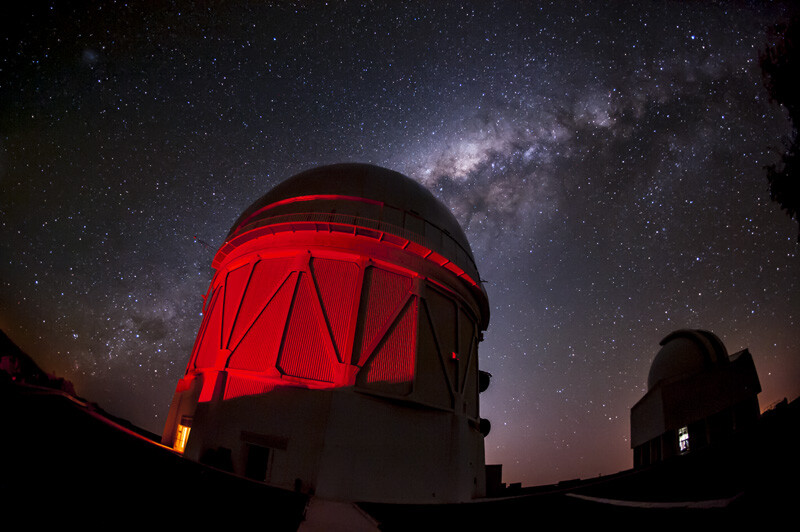
The Blanco Telescope dome at the Cerro Tololo Inter-American Observatory in Chile, where the Dark Energy Camera used for the recently completed Dark Energy Survey was housed. (Image: Reidar Hahn, Fermilab)
This interim analysis is also essential for other upcoming cosmological surveys, including the Vera C. Rubin Observatory, which will produce the deepest and widest images of the universe to date. “Very soon we will be under a deluge of data, so surveys like this are key in testing your modeling or theoretical advances using actual data,” says Pandey. “Whatever we test here is directly applicable to future surveys, and these results and the results of the final analysis will be a very important part for the community in general.”
Sánchez, who has been involved with DES since he began his Ph.D., is eager to see the final results as DES researchers continue to work on this complex, interconnected research project. “There are 30 papers, and it's not like each paper is isolated. There’s a lot of connection, and you might be waiting for something else to finish or you have to work with a preliminary analysis that then gets updated, so it was really challenging to manage such huge project,” he says.
There’s a lot of excitement about what comes next for DES, both in terms of the advancements that can be made and the unanswered questions that researchers hope to address using the entire six-year dataset. “We have the best data right now in the world, so everything you do is the first time. That’s a big responsibility, but it gives you also a lot of satisfaction,” says Gatti.
Results from the DES third-year cosmology analysis of galaxy clustering and gravitational lensing have now been released, and 26 of the 30 papers can be found at the DES Year 3 Cosmology Results website. A recording of the May 27 scientific webinar can be seen here.
Masao Sako is a professor and undergraduate chair in the Department of Physics and Astronomy in Penn’s School of Arts & Sciences. Sako co-led the DES effort to measure the expansion of the universe using distant stellar explosions and was also the co-coordinator of the Supernova group of DES.
Graduate students and postdocs from Penn who are working on DES are Pedro Bernardinelli, Cyrille Doux, Marco Gatti, Shivam Pandey, Helen Qu, Marco Raveri, Carles Sánchez, Lucas Secco, and Tae-hyeon Shi. Bernardinelli, Secco, and Shin recently received their Ph.D.s for this work.
Materials in the Annenberg School for Communication Library Archives include thousands of TV scripts, the first issue of TV Guide, and interviews about the early days of HBO—which help to chronicle TV’s 100-year story.
Centering joy in AI development and implementation
PIK Professor Desmond Upton Patton—of Annenberg and SP2—and collaborators introduce a joy-informed framework designed to initiate conversations among engineers, designers, and researchers.
Winter Storm Fern brought icy and snowy conditions to the Northeast and other parts of the country over the weekend. Penn Today asks physicist Robert Carpick about the unique properties of ice, the science of curling, and how close we are to ‘nonslip’ ice.
Organizations like Penn’s Netter Center for Community Partnerships foster collaborations between Penn and public schools in the West Philadelphia community.
Penn receives national distinction for community engagement
The recognition by the American Council on Education and Carnegie Foundation for the Advancement of Teaching acknowledges Penn’s long-standing commitment to community-engaged scholarship and partnerships in West Philadelphia and beyond.


