“Part of the problem with the data is that it’s fundamentally unreliable, but not all unreliability is created equal—state testing procedures are very different,” explains Wyner. “Because we aggregate over all the States and you have these incredibly different testing protocols, it becomes fundamentally a question of, ‘What can you infer from the data?’ On the other hand, certain states have had fairly consistent testing protocols, and then you can really see what’s happening as you march across time.
“Yes, there’s unreliability, but there’s also an ability to do something with the data even though there are problems with it because those problems, at least, are consistent. If you’re looking for the bend in the curve, or the ‘flattening of the curve,’ as long as those problems are consistent over time, you can still measure the bend. If it’s inconsistent, well, then almost all bets are off.”
This article is by Emily O’Donnell. Read more at Wharton Stories.
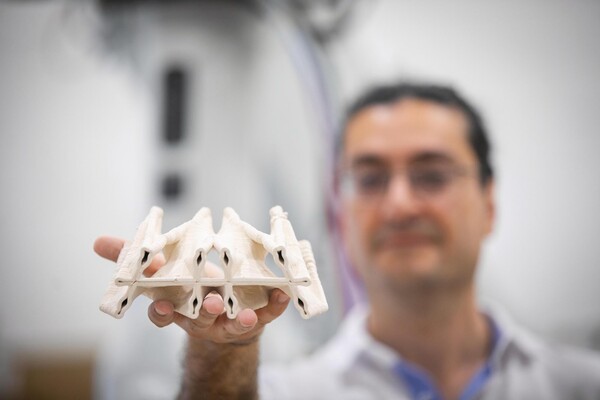
The Polyhedral Structures Laboratory is housed at the Pennovation Center and brings together designers, engineers, and computer scientists to reimagine the built world. Using graphic statics, a method where forces are mapped as lines, they design forms that balance compression and tension. These result in structures that use far fewer materials while remaining strong and efficient.
From ancient tombs and tiny robots to personalized gene editing and AI weather models, Penn’s 2025 research portfolio showed how curiosity—paired with collaboration—moves knowledge into impact and stretches across disciplines and continents.
Centering joy in AI development and implementation
PIK Professor Desmond Upton Patton—of Annenberg and SP2—and collaborators introduce a joy-informed framework designed to initiate conversations among engineers, designers, and researchers.
Reflecting on Jane Austen, 250 years after her birth
English professors Michael Gamer and Barri Joyce Gold have been teaching courses specifically dedicated to Jane Austen for years. They spoke with Penn Today about their approach to teaching her novels, how they challenge common readings and myths, and what makes Austen’s work so enduring—and adaptable to the screen—more than two centuries later.
Electronic medical records help save lives of HIV patients
Wharton’s Leandro “Leo” Pongeluppe and colleagues found that HIV clinics in Malawi that switched from paper to electronic medical records saw an estimated 28% reduction in deaths in five years.


