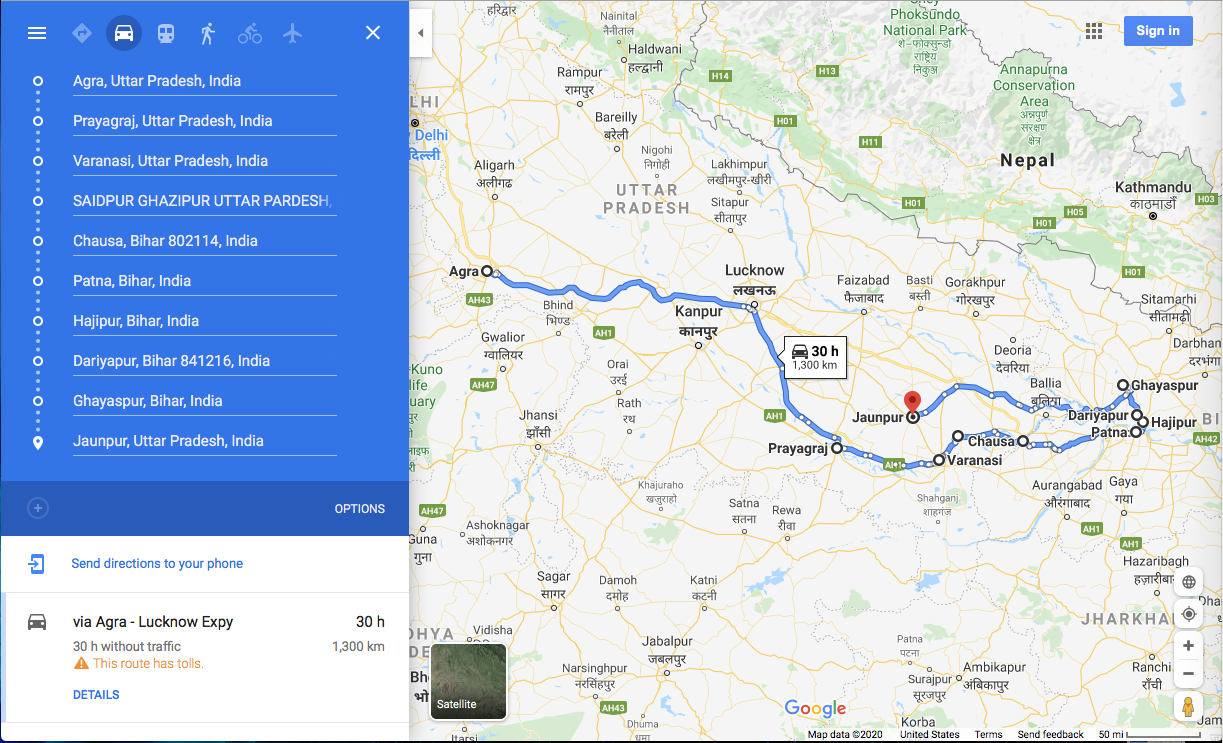
Students used Google Maps to plot out journeys described in narrative accounts. This route depicts the path Akbar (the third Mughal emperor) took in 1574 from his capital in Agra, to the eastern regions of Patna and Hajipur.
From the 16th century to the 18th century, the Mughal empire covered much of South Asia. Of central Asian descent, Mughal rulers “saw themselves as inheritors of the legacy of Mongols and Timur, world conquerors and successful rulers,” says Ramya Sreenivasan, associate professor of history in the School of Arts & Sciences. This summer, Sreenivasan worked with four undergraduates as part of the Penn Undergraduate Research Mentoring Program (PURM) to get behind the façade of the imperial state, using GIS deep mapping to ascertain how the empire was formed and maintained militarily.
Sophomores Gulzar Berdimuratova of Plymouth Meeting, Pennsylvania, and Raisa Islam of Totowa, New Jersey, along with juniors Rachel Jessamy of Elmsford, New York, and Santana Browning of Zanesville, Ohio, collaborated on the project. The two sophomores are undeclared, but Berdimuratova is thinking of majoring in international relations while Islam is pondering a double major in neuroscience and South Asian studies. Jessamy is concentrating on world history; Browning in English. Sreenivasan had originally asked for one intern, but after the pandemic hit she recognized the opportunity to expand the project’s scope and find placements for other students. Although many were new to the field at the beginning of the summer, all have gained a greater understanding of the region and of the technology, Sreenivasan says.
Sreenivasan had completed a 2019-20 fellowship at the Price Lab for Digital Humanities where she became inspired to use data visualization to interpret history. Historians “get very set on reading our sources in particular ways,” Sreenivasan says. “We learn how to read, and then we keep looking for the same things over and over again.” Sreenivasan saw data visualization as a way of looking beyond the official accounts produced at the Mughal courts, which portrayed the empire as “incredibly successful and powerful,” Sreenivasan says.
The fort at Agra, which served as the main residence of Mughal emperors until the capital moved to Delhi in 1638. (Image: Ramya Sreenivasan)
She began thinking about political control, and what that might look like on the ground. “What did it give elites the power to do? What did it look like for elites and their subjects who were starting to be governed by new regimes?” Sreenivasan and the student team began work with Girmaye Misgna, mapping and geospatial data librarian with the Penn Libraries,in order to translate qualitative data from Mughal court records into spreadsheets and points on a map. “I think it’s a really interdisciplinary and unique way to consider data,” Browning says.
The digital humanities enterprise was “a learning experience together,” Islam says. “While the students were new to the techniques, Ramya took a step-by-step approach, where we built on a digital humanities component very incrementally,” Berdimuratova says. “When I first looked at the examples, they seemed so complex and convoluted, but then I realized that this is something that you keep building, one-by-one with little sections of the data. And I think that’s what helped the most like knowing that we were all like building this up together.”
After “weeks of working, the raw data became something that we could visualize and see before our eyes,” Berdimuratova says. Visualization helps researchers as well as the project’s audience, she says. “I thought it was the coolest component and definitely a skill that I will take into my future projects.”
The team produced screen-capture images of maps they plotted on Google Maps and Google Earth and began creating timelines, Sreenivasan says. Deep mapping is “not just mapping on a GIS,” Misgna says. “It’s audios, videos, charts, and essays to explain all these layers of experience. During the process, we look for the appropriate twist.” The project “has all the components of what deep mapping does,” Misgna says. “It’s a huge temporal space. There are empires, language, migration, kinship, genealogy, and layers of experiences that have to be visualized and expressed” through a diverse set of tools.
Story mapping was one of the tools the group used to create a layered, immersive data experience. (Image: Girmaye Misgna)
“In geography, there is often a distinction between what is a space and what is a place,” Misgna says. “A space refers to a fixed coordinate location on a reference surface. Place has layers of experience of people living in those locations, like histories, language, politics, power, and they all come contested. It is a lot more rich and deep. I suppose that is why it’s called deep mapping.”
Their findings changed the way the group thought about empire, Sreenivasan says. “You start to plot the places on a map and think about the precise dates these battles took place. You go back to the narrative account and say, ‘Wait, how many men were involved here?’ What looks in the narrative account like a series of three battles actually took place over 15 months.” What she thought was “just a rebellious province” in fact waged a three-year war against the Mughal overlord, during which time parts of the province were not under Mughal rule, Sreenivasan says. “Empire becomes much more contingent.” In considering the “apparatus of the empire”—the battles, the taxes, the movement of men, animals and weapons—other questions emerged about the place of continuing, low-level warfare in pre-modern and early modern empires, Sreenivasan says. The history started to come alive as they asked, “How do you send these men? What do supply chains look like? How did the horses and elephants travel? Who’s provisioning fodder?” she says.
The Bhakkar fort in modern-day Pakistan. (Image: Ramya Sreenivasan)
“People have this perception that it was just this great and powerful empire, everything was peaceful after the initial conquest,” Islam says. “But certain parts of the empire had to be repeatedly subjugated.” The project “took something that was accepted in the field as a fact and turned it on its head.”
The project was a “great introduction to academic research” because Sreenivasan was so accessible and open “about the fact that she didn’t know everything,” Browning says. It wasn’t esoteric and closed off to beginners, she says. At the close of the project, the students worked with Sreenivasan on an article, which they are planning to submit to the Digital Humanities Journal. “It’s really exciting to put something out there that could be of use to other scholars,” Jessamy says.
Materials in the Annenberg School for Communication Library Archives include thousands of TV scripts, the first issue of TV Guide, and interviews about the early days of HBO—which help to chronicle TV’s 100-year story.
Centering joy in AI development and implementation
PIK Professor Desmond Upton Patton—of Annenberg and SP2—and collaborators introduce a joy-informed framework designed to initiate conversations among engineers, designers, and researchers.
Winter Storm Fern brought icy and snowy conditions to the Northeast and other parts of the country over the weekend. Penn Today asks physicist Robert Carpick about the unique properties of ice, the science of curling, and how close we are to ‘nonslip’ ice.
Organizations like Penn’s Netter Center for Community Partnerships foster collaborations between Penn and public schools in the West Philadelphia community.
Penn receives national distinction for community engagement
The recognition by the American Council on Education and Carnegie Foundation for the Advancement of Teaching acknowledges Penn’s long-standing commitment to community-engaged scholarship and partnerships in West Philadelphia and beyond.


