The bipartisan Senate infrastructure deal, endorsed by President Joe Biden, authorizes $1.2 trillion of spending, representing more than $570 billion in additional infrastructure investments compared to current policy, according to a new report from the Penn Wharton Budget Model (PWBM).
“The infrastructure proposal would provide more than twice as much federal aid to infrastructure investment over the next five years,” says Jon Huntley, senior economist for the PWBM. “This is a large increase in the amount of money spent on roads, internet, water, rail, and other types of public infrastructure.”
If passed, about $313 billion of the $1.2 trillion will go toward transportation projects, and $266 billion will go toward digital, disaster, environmental, and energy infrastructure investments. Of that $313 billion, about $49 billion is dedicated to public transportation, which includes low-emissions and electric transit. Another $66 billion is dedicated to rail service, $25 billion to airport facilities, and $16 billion to ports and waterways. About $120 billion is dedicated explicitly to roads.
“A significant amount of this money is dedicated to water infrastructure, which includes replacing a lot of public water pipes,” says Huntley. “More still goes toward building out digital infrastructure; bringing the productivity benefits of high-speed internet access to places that don’t already enjoy them. And lastly, some of the money goes toward supporting electric vehicles (EVs).”
This investment will look to support EV adoption as they become more popular, helping to build out infrastructure so that EV owners can maximize the usefulness of their vehicles, according to Huntley.
That new spending would be financed with a mix of additional deficits (relative to current policy), user fees, and other tax provisions. The $125 billion in revenue from “unused” funds—COVID, unemployment insurance, and broadband—add to the debt relative to the baseline in which the funds were not spent and thus return to the Treasury. In addition, the announced deal allocates revenues from the sale of spectrum and oil totaling $71 billion.
“The money from unused funds would have gone back to the U.S. Treasury, which would have reduced the amount of government debt,” says Huntley. “Allocating those funds to new infrastructure spending proposals causes the Treasury to borrow more money than it otherwise would have, and government debt increases.”
PWBM estimates that the proposal would decrease debt by 0.9 percent and increase GDP by 0.1 percent in 2050. The bulk of the spending on infrastructure occurs in the first few years. The spending during the first decade outpaces the increase in revenues, which leads to a 0.4 percent increase in government debt. Over time, as the new spending declines, IRS enforcement continues, and revenue grows from higher output, the government debt declines relative to baseline by 0.4 percent and 0.9 percent in 2040 and 2050 respectively.
“The headline numbers look small—0.1 percent of GDP does not appear to be a large number—however, these benefits continue to accumulate year after year for as long as the infrastructure is in use,” Huntley says.
PWBM is a nonpartisan research organization that provides economic analysis of the fiscal impact of public policy, housed at the Wharton School of the University of Pennsylvania.
Nanoparticle blueprints reveal path to smarter medicines
New research involving Penn Engineering shows detailed variation in lipid nanoparticle size, shape, and internal structure, and finds that such factors correlate with how well they deliver therapeutic cargo to a particular destination.
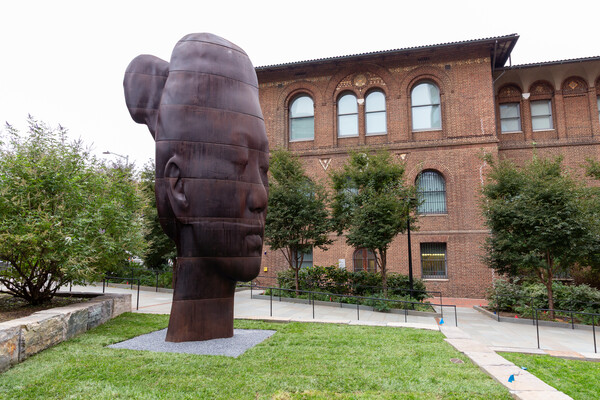
A generous gift from alumni Glenn and Amanda Fuhrman brings the work of internationally acclaimed artist Jaume Plensa to the University of Pennsylvania. The latest addition to the Penn Art Collection expands Philadelphia's public art.
A massive chunk of ice, a new laser, and new information on sea-level rise
For nearly a decade, Leigh Stearns and collaborators aimed a laser scanner system at Greenland’s Helheim Glacier. Their long-running survey reveals that Helheim’s massive calving events don’t behave the way scientists once thought, reframing how ice loss contributes to sea-level rise.


