What are the economic and health effects when states reopen?
New Penn Wharton Budget Model predicts 212,000 additional deaths related to the coronavirus but the recouping of around 18 million jobs by July 15 if all states fully reopen.
Wharton professor and faculty director Kent Smetters leading a virtual panel discussion on the Penn Wharton Budget Model.
Governors of the tristate area have a lot to consider before fully reopening. After weeks of enforcing statewide social distancing, Pennsylvania Governor Tom Wolf recently extended his stay-at-home order until June 4.
Wolf’s plan has divided Pennsylvania into color-coded zones. Those in the red phase, which include the Philadelphia region, have the most restrictions on businesses and gatherings. Some restrictions are lifted in the yellow phase, while even more are lifted in green.
Parts of central and western Pennsylvania have recently been moved to, or are set to move to, the yellow phase.
“The stay-at-home orders and business restrictions have taken an economic toll, to be sure,” Smetters says. “But those social distancing policies are designed to reduce coronavirus cases and deaths. Faster reopening will stem the job loss, but at the price of more deaths. Policymakers need to understand the magnitude of this tradeoff as best they can, and PWBM’s analysis uses real-time data to relate distancing policies and practices to both the economic and public health outcomes.”
The PWBM is a nonpartisan initiative providing economic analysis of public policy’s fiscal impact for policymakers to make data-based decisions. This analysis was presented in a Wharton LinkedIn Live event on May 5.
The simulator, which is updated weekly, shows health and economic projections for each state through mid-July. These projections include employment change based on different scenarios of state reopening, and projections of cumulative reported cases and deaths related to the coronavirus.
Alexander Arnon (left) came to the Penn Wharton Budget Model with a background in public policy analysis and economic research. John Ricco (right) is an economic analyst specializing in tax policy and urban economics.(Image: Wharton)
PWBM held a virtual panel discussion May 5 with Smetters and senior analysts Alex Arnon and John Ricco. Both Arnon and Ricco worked on the simulator. The simulator was created to predict how people might act under different lockdown policies, according to Smetters.
Here’s what the model shows: Many states have already started to reopen a little bit. If the states continue these policies without additional openings, the PWBM predicts the U.S. would reach about 150,000 COVID-19 deaths nationally through the middle of July. Moreover, approximately 6.1 million additional jobs would be lost over the next two months. This amount is in addition to the more than 21 million jobs already lost in March and April as reported by the Bureau of Labor Statistics, plus additional losses since mid-April—and an effective unemployment rate of more than 20 percent of the workforce.
“Different states have already started to reopen to varying degrees,” Arnon says. “If they were to freeze current policies through mid-July, assuming citizens’ compliance with those policies is also unchanged—we would experience a ‘best-case scenario’ in terms of the lowest additional deaths over the next two months, adding about 65,000 deaths to the cumulative total. But in terms of the corresponding effects on short-term economic activity, it would be a worst-case scenario.”
If states partially reopen even more, the PWBM shows around 33,000 additional deaths during the same time period (cumulative 183,781 vs. 150,854 under baseline policies), but employment would actually increase (by around 100,000 jobs) instead of decrease from mid-May to mid-July.
“Partial reopening under current behavioral practices would increase additional deaths by around 50 percent, but would stop continued job losses,” Arnon says. “Instead of losing an additional 6.1 million jobs, we would regain about 100,000.”
And if all states fully reopen, the PWBM estimates around 363,000 cumulative deaths related to COVID-19 by mid-July—or 212,000 more than under baseline policies—and 11.5 million jobs added (regained) over the two-month period.
Wharton professor and faculty director Kent Smetters leading a virtual panel discussion on the Penn Wharton Budget Model which released a new report that estimates the national and state-level economic and public health consequences of reopening businesses and relaxing stay-at-home orders brought on by the COVID-19 pandemic.
However, another critical factor in the analysis is how people personally respond even outside of policy. For example, people might misinterpret the lifting of public policy mandates around social distancing as an indicator that their own risk is low, thereby relaxing their personal social distancing, according to Ricco.
“People’s behavior matters a lot,” he says. “Under reduced distancing behavior and full reopening policies, cumulative deaths approximately double compared with current behavior under full reopening, yet the job loss and GDP numbers improve to a much smaller extent.”
PWBM’s simulator is unique from others in its ability to project the impact of different levels of policy for each state based on data at the county and even zip-code level, like population density, public transit, and labor force and industry characteristics. Rather than running two economic and epidemiological models separately in parallel, the PWBM is fully integrated, which is key for determining the impact of policy changes on economic and health variables.
“The epidemiological and economic conditions vary tremendously across states and within each state—we consider all these factors and their evolution and interaction on a daily basis in building our estimates,” Ricco says.
The simulator uses a range of data from Johns Hopkins, the American Community Survey, and other sources at the state and local levels. Beyond industry composition and labor force data, the model also includes cell phone data, business openings, web searches, payroll, and even weather data (among other data) at the county and often zip-code level. Because much of this data changes daily, PWBM updates their data inputs and analysis each week.
“We update our data and forecasts about once per week, typically on Mondays, and move our two-month forecast window forward each week,” notes Smetters.
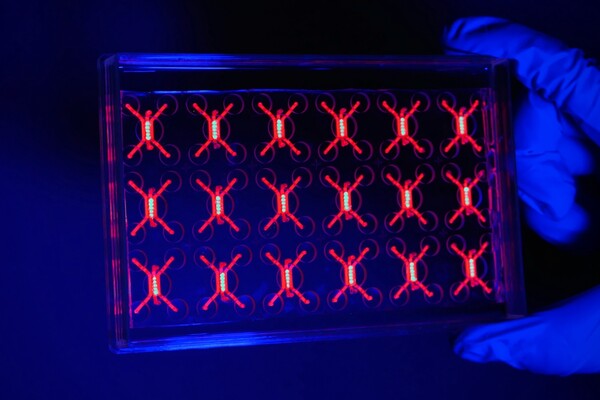
Penn engineers and collaborators have developed a transparent, micro-engineered device that houses a living, vascularized model of human lung cancer—a “tumor on a chip”—and show that the diabetes drug vildagliptin helps more CAR T cells break through the tumor’s defenses and attack it effectively.
Tumor-on-a-chip offers insight into cancer-fighting cells in immunotherapy
Penn engineers and collaborators have built a living tumor on a chip to expose how cancers block immune attacks, and how one existing drug could make immunotherapy like CAR T more effective against solid tumors.
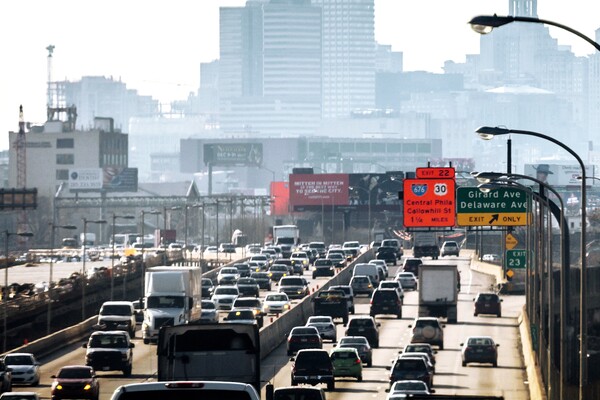
Professor of city and regional planning Erick Guerra recently published a book exploring the economic and societal impacts of American highways. He explains some of the pitfalls associated with an ever-expansive highway system, arguing that spending more on highways might not be the solution to the country’s transportation issues.
Penn urban planner Erick Guerra’s new book, “Overbuilt,” argues that additional spending on building more highways might not be the solution to the country’s transportation issues. In a Q&A, Guerra shares his insights.
Xin Sun prepares samples collected from the Eastern Tropical North Pacific aboard a research vessel. By adding stable isotope tracers to these vials, Sun and her team can track how different microbial groups convert nitrogen compounds into nitrous oxide, revealing how subtle shifts in oxygen and organic matter change the ocean’s chemistry.
Can tiny ocean organisms offer the key to better climate modeling?
In the shadowy layers of the Pacific, microbes decide how much nitrous oxide—a potent greenhouse gas—rises skyward. New research from Penn’s Xin Sun offers an improved understanding of microbial ecology and geochemistry—key to forecasting global emissions in response to natural and man-made climate change.
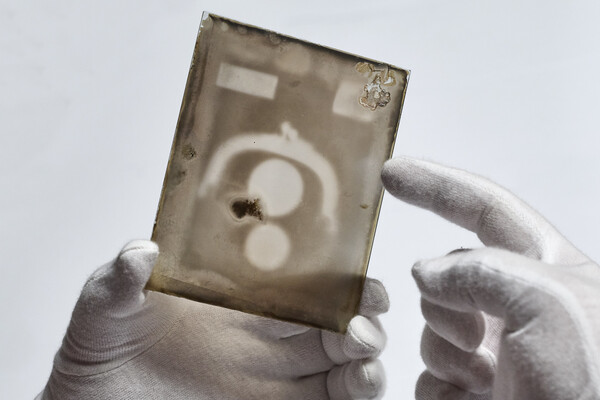
Two X-ray plates from Arthur Goodspeed, believed to have created the world’s first X-ray image, were donated by his family to Penn’s University Archives.


