A new analysis found that overall mobility in large U.S. cities has yet to return to pre-pandemic levels, and some are also experiencing changing segregation patterns, with potential implications that could last well beyond the pandemic.
A new study, recently presented at the GISRUK conference, found that overall mobility in large U.S. cities has yet to return to pre-pandemic levels. Using tools from geographic information system (GIS) analysis and data science, geospatial researcher Andrew Renninger also found that some of these cities are experiencing changing segregation patterns.
Just over a year since the pandemic led to shut-downs and stay-at-home orders across the world, the rollout of vaccines and gradual reopening of long-shuttered parts of the economy have many wondering when life will return to a pre-pandemic normal. But amidst the numerous changes this past year to how people work, shop, travel, and go about their day-to-day routines, how close is society to getting back to the way things were before COVID-19?
In an analysis presented at the GISRUK conference, geospatial researcher Andrew Renninger found that overall mobility in large cities in the United States has yet to return to pre-pandemic levels. Using tools from geographic information system (GIS) analysis and data science, this study also found that some of these cities are experiencing changing segregation patterns, with potential implications on the structure of metropolitan areas that could last well beyond the pandemic.
In March of 2020, SafeGraph reached out to the Wharton GIS Lab with an interest in understanding the impact of the pandemic on mobility and provided Renninger and his team with a massive dataset of mobile phone counts. Renninger decided to focus his analysis on “superstar cities,” a term coined by economists in a 2006 paper for cities with high real estate demand and inelastic supply that leads to rising housing prices relative to median income, with examples in the U.S. including San Francisco, Seattle, and New York.
“There’s a huge debate raging in terms of if these expensive cities will ever get back to their 2019 baseline or if people will flee for good,” says Renninger. “What we want to look at is whether the pandemic is going to change these big cities forever or will they bounce back, which is why we’re looking at big cities in particular.”
Starting last spring, Renninger began to analyze millions of individual smartphones at different locations. Using this dataset, Renninger can study movements between an individual’s point of origin and destination to see if there were any changes to mobility networks across time and space in 100 of the largest cities in the U.S.
The number of visits to different parts of Philadelphia on a monthly basis throughout 2020. The interconnectedness of the city was dramatically changed by the pandemic, with the largest decline seen in Center City. (Image: Andrew Renninger and Ken Steif)
One of the things that immediately stands out to Renninger is how “night and day” mobility still is in large U.S. cities. In Philadelphia specifically, leisure industries, such as restaurants and bars, are still experiencing greatly reduced footfall from January of last year, and the Center City area of Philadelphia has seen more than a 70% reduction in traffic from its typical peak. “The data tell a stark story of how little we are doing compared to before the pandemic,” he says. “The visuals show a huge drop, and it probably will take a long time for things to get back to normal.”
In addition to this general and continued reduction in movement, Renninger’s analysis showed an increase in segregation in cities like San Francisco and New York. In these cities, there was an increase in community homogeneity, with people less likely to interact with neighborhoods that differ from their own. Renninger also found that degree centrality, or how many other neighborhoods a person visits outside their own, and network density, or how connections between neighborhoods became sparser or denser, both decreased dramatically during the pandemic and have yet to return to pre-pandemic levels.
“As visits declined, neighborhoods realigned,” says Renninger. “People are going to fewer new neighborhoods, and the consequence is that people are less likely to interact with people from other races, so we’ve become more segregated. That has profound consequences in terms of the purpose of a city, and it’s a big deal if people don’t interact with each other.”
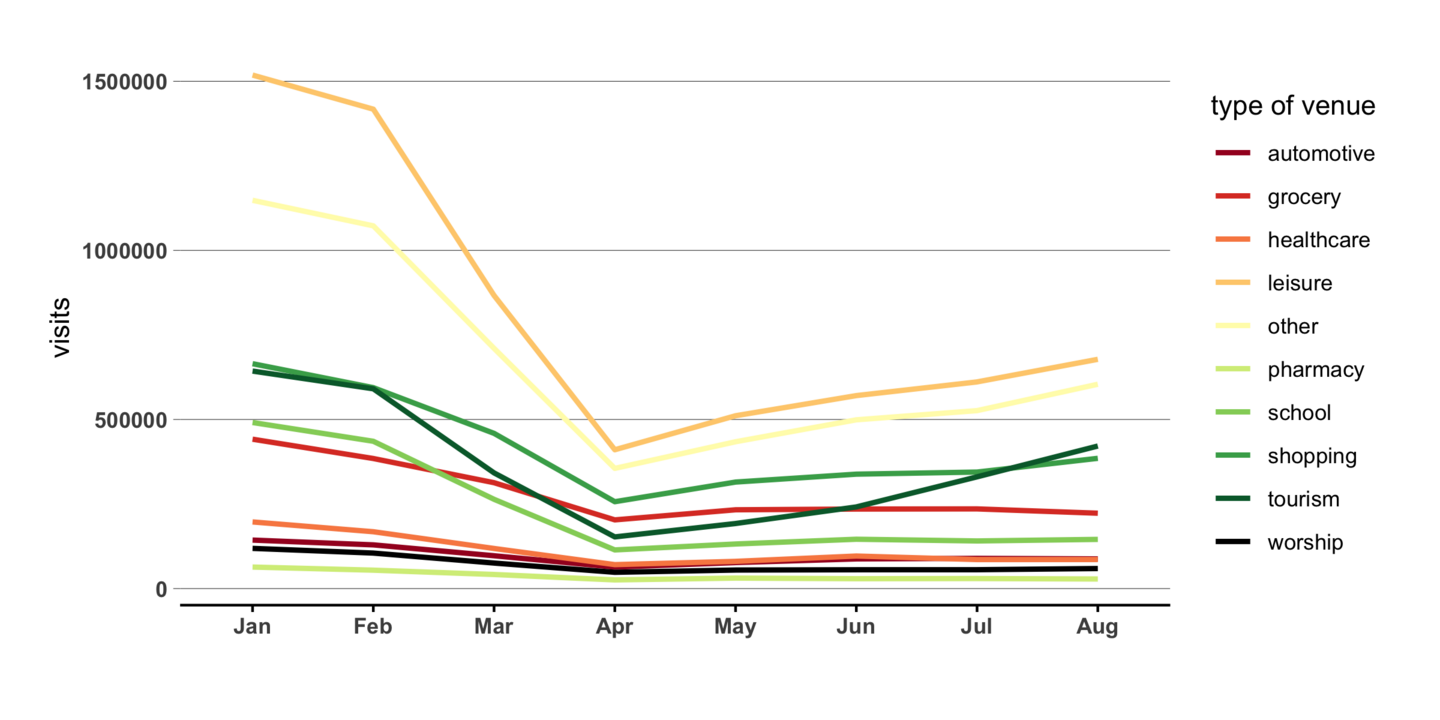
Aggregated visits by industry type. Stay-at-home orders reduced visits to all industries overall last spring, and some venues, such as leisure (which includes restaurants and bars) remaining well below their pre-pandemic levels as of late last year. (Image: Andrew Renninger and Ken Steif)
This analysis and the methods developed by Renninger to obtain insights from this complex dataset have potential implications for city planners and officials who will need to understand the way that large cities might be changing because of COVID-19. This could include shifting transportation needs, better access to green space, and providing more decentralized amenities such as restaurants and gathering spaces if downtowns fundamentally change post-pandemic.
Continued monitoring of mobility patterns will also be crucial to understand, track, and test hypotheses around how cities might be changing moving forward, Renninger says. “The task for the next year will be to keep monitoring if people are going back to what they were doing or if there’s going to be a drift, and this data really calls to that,” he says.
Novel plant-based approach to a better, cheaper GLP-1 delivery system
Research led by Penn Dental’s Henry Daniell investigates the use of a lettuce-based, plant-encapsulated delivery platform as a new oral delivery of two GLP-1 drugs previously approved by the FDA in injectable form.
No brain, no gain: Neuronal activity enhances benefits of exercise
Research led by Penn neuroscientist J. Nicholas Betley and collaborators finds that hypothalamic neurons are essential for translating physical exertion into endurance, potentially opening the door to exercise-mimicking therapies.
In honor of Valentine's Day, and as a way of fostering community in her Shakespeare in Love course, Becky Friedman took her students to the University Club for lunch one class period. They talked about the movie "Shakespeare in Love," as part of a broader conversation on how Shakespeare's works are adapted.
In Becky Friedman’s English course Shakespeare in Love, undergraduate students analyze language, genre, and adaptation in the Bard’s plays through the lens of love.
Beating the heat: Designing cooling for bodies in motion
Dorit Aviv, director of Weitzman’s Thermal Architecture Lab, studies how humans, technology, and design intersect, paving the way for the development of novel approaches to cooling people efficiently.


