To improve climate models, an international team turns to archaeological data
The project, called LandCover6k, offers a new classification system that the researchers hope will improve predictions about the planet’s future and fill in gaps about its past.
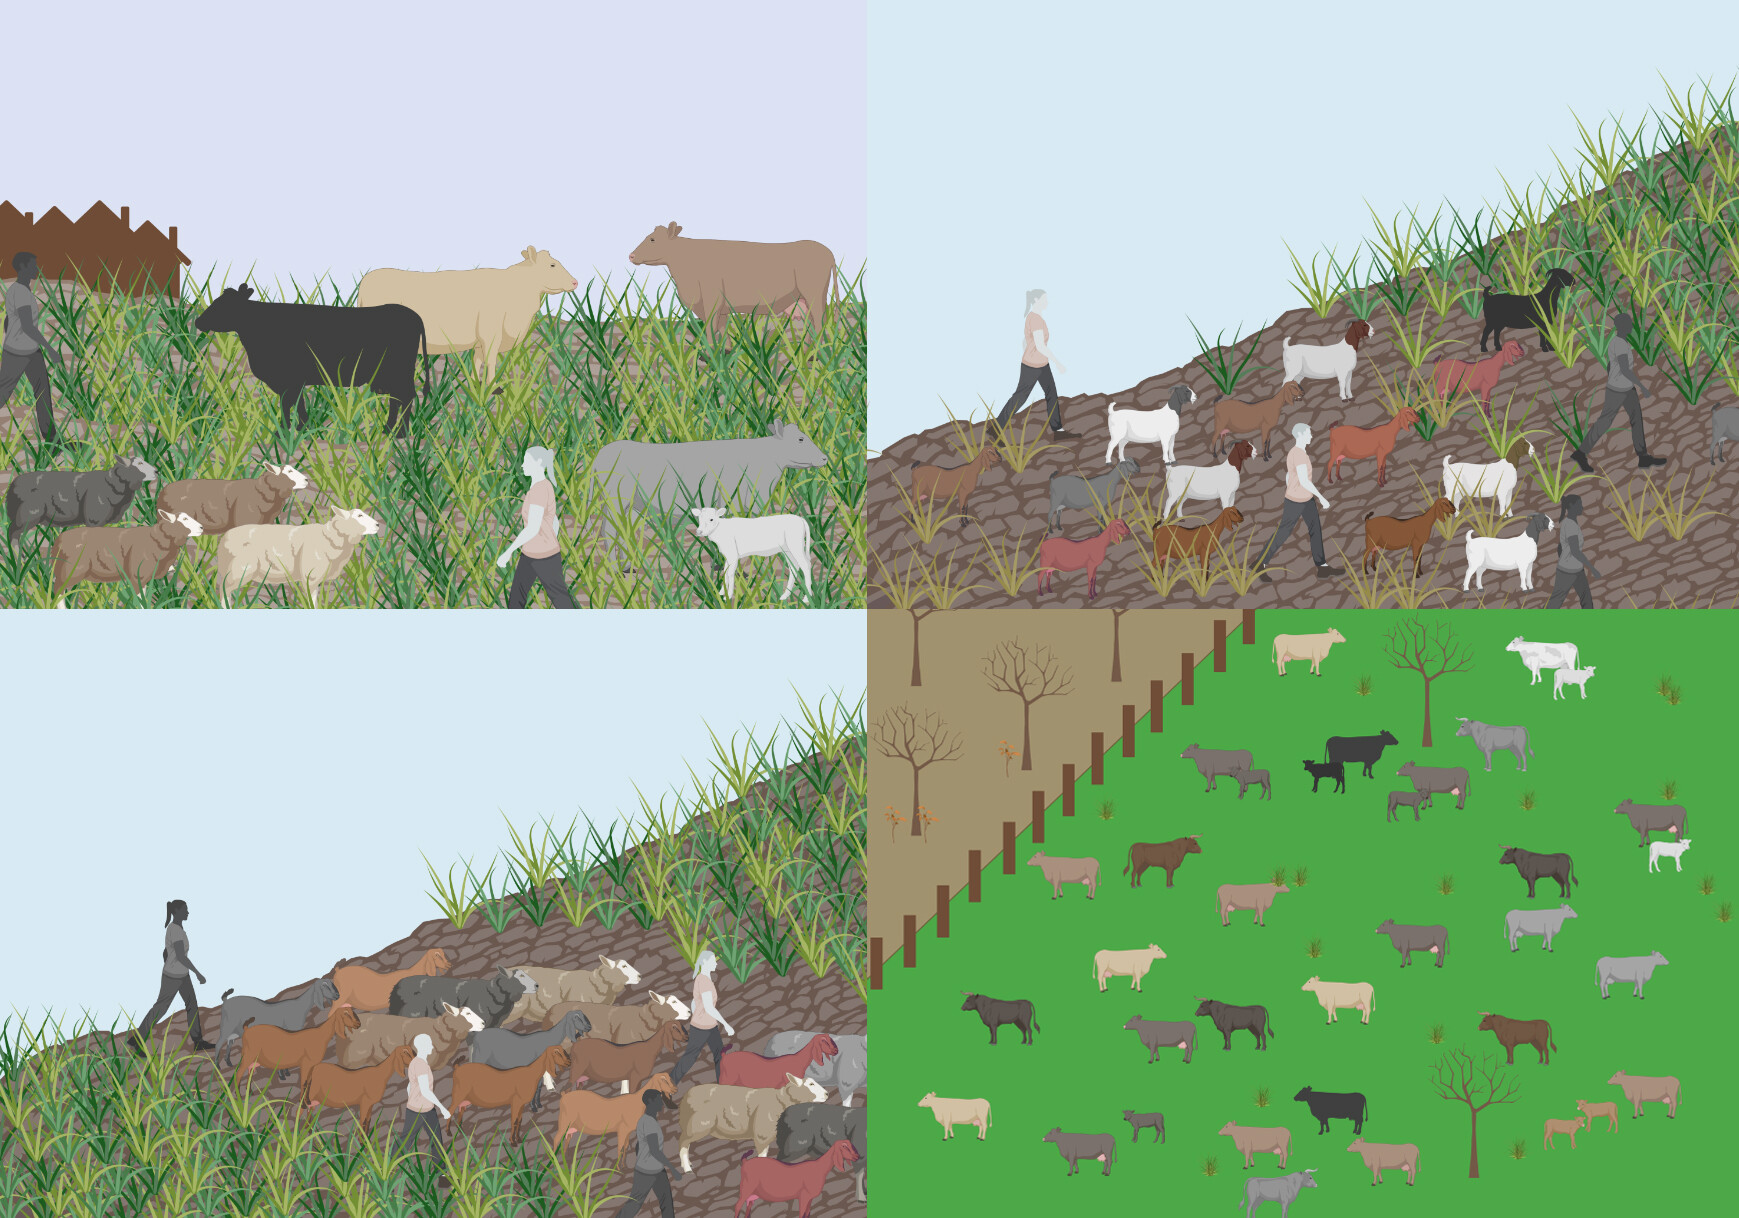
The LandCover6k project uses a hierarchical classification system. An upper-level category captures an idea at its broadest, with several distinct subcategories funneling down from there. This quartet show the subgroups of the “pastoralism” category (from top left, clockwise): “Anchored pastoralism,” shown as sheep and cattle near a settlement; “ranching,” with cattle enclosed in pasture land; “mobile, irregular,” with sheep and goats moving along a less well-trodden path; and “mobile, regular,” with those same animals shepherded along a specific path. (Image: Jennifer Bates, created with Biorender, published in PLOS ONE)
Climate modeling is future facing, its general intent to hypothesize what our planet might look like at some later date. Because the Earth’s vegetation influences climate, climate models frequently include vegetation reconstructions and are often validated by comparisons to the past. Yet such models tend to get oversimplified, glossing over or omitting how people affected the land and its cover.
The absence of such data led to LandCover6k, a project now in its sixth year that includes more than 200 archaeologists, historians, geographers, paleoecologists, and climate modelers around the world.
Understanding the human impact on the Earth is more than looking at past vegetation. It’s also important to understand how humans used the land.
Archaeologist Kathleen Morrison
The project offers what the researchers hope will become a tool to improve predictions about the planet’s future, plus fill in gaps about its past. “Understanding the human impact on the Earth is more than looking at past vegetation. It’s also important to understand how humans used the land and in particular, the relationship between human land use and vegetation,” Morrison says.
Though current Earth system models suggest that human activity during the past 12,000 years influenced regional and global climate, Madella says, “the models do not capture the diversity and intensity of human activities that affected past land cover, nor do they capture carbon and water cycles.”
Archaeology provides important information around land use that “helps reveal how humans have affected past land cover at a global scale,” adds Whitehouse, “including the crops and animals being farmed, how they were being farmed, and how much land was needed to feed growing populations.”
In a new PLOS ONE paper, the team provides a detailed introduction to LandCover6k’s land-use classification system and global database.
Creating a common language, system
To share such data meant first creating a common language that scientists across disciplines could understand. It’s a task more fraught than it might sound, Morrison says. “Classification means putting hard edges on something. That’s very challenging, as archaeologists are often much more comfortable with narrative.”
Partially because of a lack of shared terminology, archaeologists have not tried to aggregate and compare data on a global scale, something the project’s paleoecologists and modelers had already been doing, she adds. “We spent years consulting with colleagues around the world, discussing all the different types of land use and developing a communication system—the same language, the same terminology—that could be used anywhere.”
More than 200 archaeologists, historians, geographers, paleoecologists, and climate modelers around the world contributed to LandCover6k, through workshops like one shown here in Pondicherry, India, in March 2019. V. Selvakumar (foreground), a professor at Tamil University, also visited Penn to complete land use mapping in southern India. (Pre-pandemic image: Courtesy Kathleen Morrison)
Because such categories historically have had different meaning depending on place, context, and time period, some archaeologists initially balked at committing to single definitions for each. Hammer offers the concept of “farming” as an example. “The line between what is called ‘farming’ and what is considered small-scale food production by hunter-gatherers really varies across the world,” she says. So, how could the field fairly judge when the actions of hunter-gatherers managing wild plant and animal resources became “farming”?
Questions like these prompted the LandCover6k team to create a hierarchy within the classification system, with an upper-level category capturing an idea at its broadest and several distinct subcategories funneling down from there. In the farming example, the research team created a subgroup—low-level food production—which could include the work of the hunter-gatherers. The hope was to offer enough nuance for the archeological community yet still make the data accessible to climate modelers.
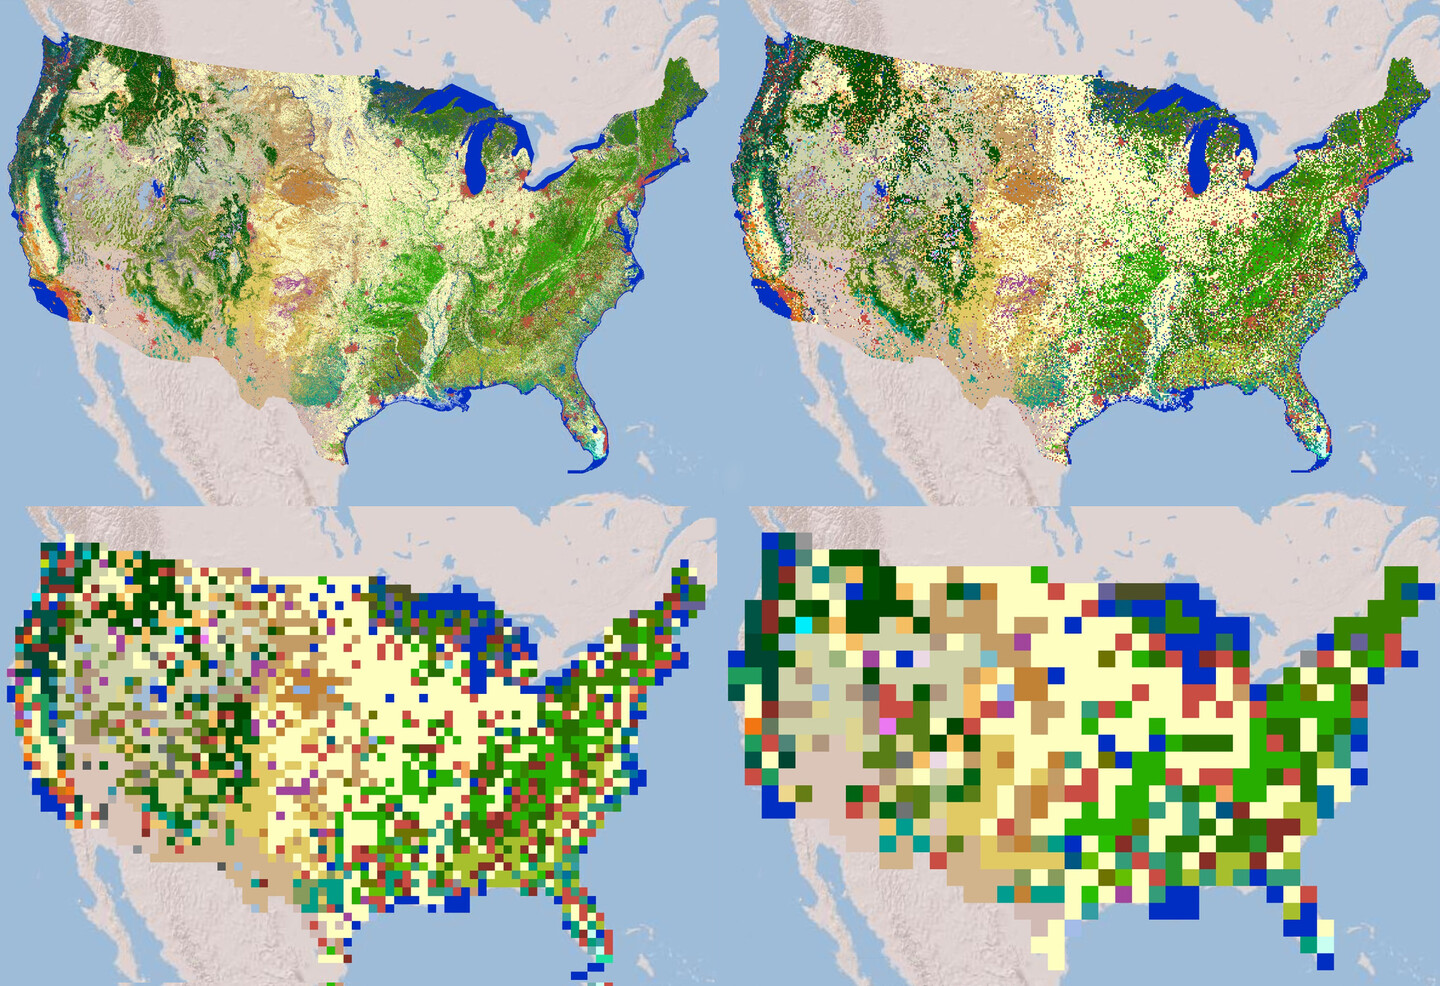
In addition to this flexible hierarchy and the uniform terminology, the final classification has three other principal features. It is scale- and source-independent, meaning it accounts for the myriad ways something can be studied. It “takes the perspective of land rather than people,” as the researchers write in PLOS ONE, and it employs a consistent 8x8 kilometer grid scale. “That’s quite large, from an archaeological perspective,” Hammer says, “but we did that so that one person isn’t drawing something very small and another person very large.”
Concrete examples
To showcase how the classification works, the researchers offer the example of the Middle East 6,000 years ago. This region, the area represented by modern day Iraq, Syria, Jordan, Kuwait, Saudi Arabia, Qatar, Bahrain, the United Arab Emirates, Oman, and Yemen, was home to some of the earliest agriculture in the world. Using the new classification and database, project participants built a regional land-use map, despite data availability differing from one spot to the next.
RELATED
“Mesopotamia has been studied since the mid-19th century so there’s a lot of data and a lot of syntheses to rely on,” Hammer explains. “Arabia has not been nearly as well-studied. There are only a couple of data points, particularly for this period, and because of climatic events, the data are even rarer than for other periods. We wanted to illustrate the approach you would take in a situation where you have a lot of data versus a place with just a little.” The new map of Middle Eastern land is proof of concept for the project, showing the contrast between the settled farms of Mesopotamia and the more sparsely settled lands of Arabia.
The researchers don’t see information gaps, like those of Arabia, as problematic. Rather because the land-use database also records data coverage and quality, it can highlight areas needing more research. “Humans have transformed landscapes for thousands of years,” Morrison says. “But we can’t just say that. We have to demonstrate it.”
And that’s just what LandCover6k aims to do, merging what archaeologists have gleaned about human land use from different times and places into a single, accessible database for climate modelers—and each other. “This project is really about translating what we do,” Hammer says, “not only about the standardization of the terminology so we can talk at a global scale, but also about weaving together the narratives of the past.”
The final classification employs an 8x8 kilometer grid scale, large from an archaeological perspective but which allows for consistency. The four maps here show the effect of grid size on data visibility. (Image: Chad Hill, published in PLOS ONE)
LandCover6k is a working group of Past Global Changes (PAGES), part of Future Earth, an international community of sustainability scientists. Funding came from the Office of the Provost at the University of Pennsylvania, Universitat Pompeu Fabra, PAGES, and the International Union for Quaternary Research. Austin Chad Hill and Jennifer Bates, postdoctoral fellows in the Department of Anthropology at the University of Pennsylvania, also contributed to the research.
Penn physicists led by Bo Zhen have created hybrid light-matter particles that interact strongly enough to compute, pointing toward ultrafast, low-energy optical AI hardware.
Penn’s newest supercomputer is transforming research
Penn’s first campus-wide HPC and AI cluster, “Betty,” is expanding access to powerful computing, enabling groundbreaking projects, and fostering new collaborations across disciplines.
A bioengineered bean gum from the lab of Penn Dental’s Henry Daniell is found to reduce the levels of three microbes associated with head and neck squamous cell cancer to almost zero, without affecting the beneficial bacteria normally found in the mouth.
Fighting oral cancer with bioengineered chewing gum
Research led by Penn Dental’s Henry Daniell shows that antiviral and antibacterial chewing gums reduce the levels of three microbes linked to worse outcomes in oral cancers, paving the way for more effective and affordable therapies.
The performing arts at Penn: Process, practice, and purpose
In the vivid tapestry of performing arts groups at Penn, students prepare for their performances while simultaneously enriching their college experience.


